The Fastest Way to Start with Graph Analytics: 360 Models + GraphStudio
Graph initiatives fail when teams treat graph as a data-loading exercise instead of a modeling discipline. Starting with a contained 360 graph model forces clarity around entities, relationships, and traversal logic before scale introduces complexity.
GraphStudio provides an interactive environment for validating that structure. Together, disciplined modeling and iterative validation reduce rework, accelerate time-to-insight, and create a stable foundation for production-scale graph analytics.
Most graph projects do not fail because graph is complex. They fail because teams try to scale ambiguity.
Organizations often begin by ingesting large volumes of data, assuming insight will emerge once everything is connected. Instead, they end up with an overloaded schema, inconsistent relationship definitions, and queries that reflect guesswork rather than design.
Graph analytics requires a different starting point.
It requires a contained, well-defined 360 domain model that reflects how a business actually operates. When teams begin with structure and validate it in GraphStudio, they eliminate early confusion and prevent downstream architectural drift.
The fastest way to start is not by loading everything. It is by modeling intentionally.
Before examining what goes wrong and how to correct it, the core principles are straightforward.
Key Takeaways
- Graph success depends on modeling clarity, not initial data volume.
- A 360 graph model defines entities and relationships before scale introduces ambiguity.
- Validating traversal logic early prevents schema drift and expensive rework.
- GraphStudio enables rapid iteration on structure, not just visualization of data.
- Connectional problems such as fraud, supply chain resiliency, and identity resolution require multi-hop reasoning from the start.
- Disciplined modeling makes scaling additive rather than corrective.
Those principles become clearer when we examine how most graph initiatives begin.
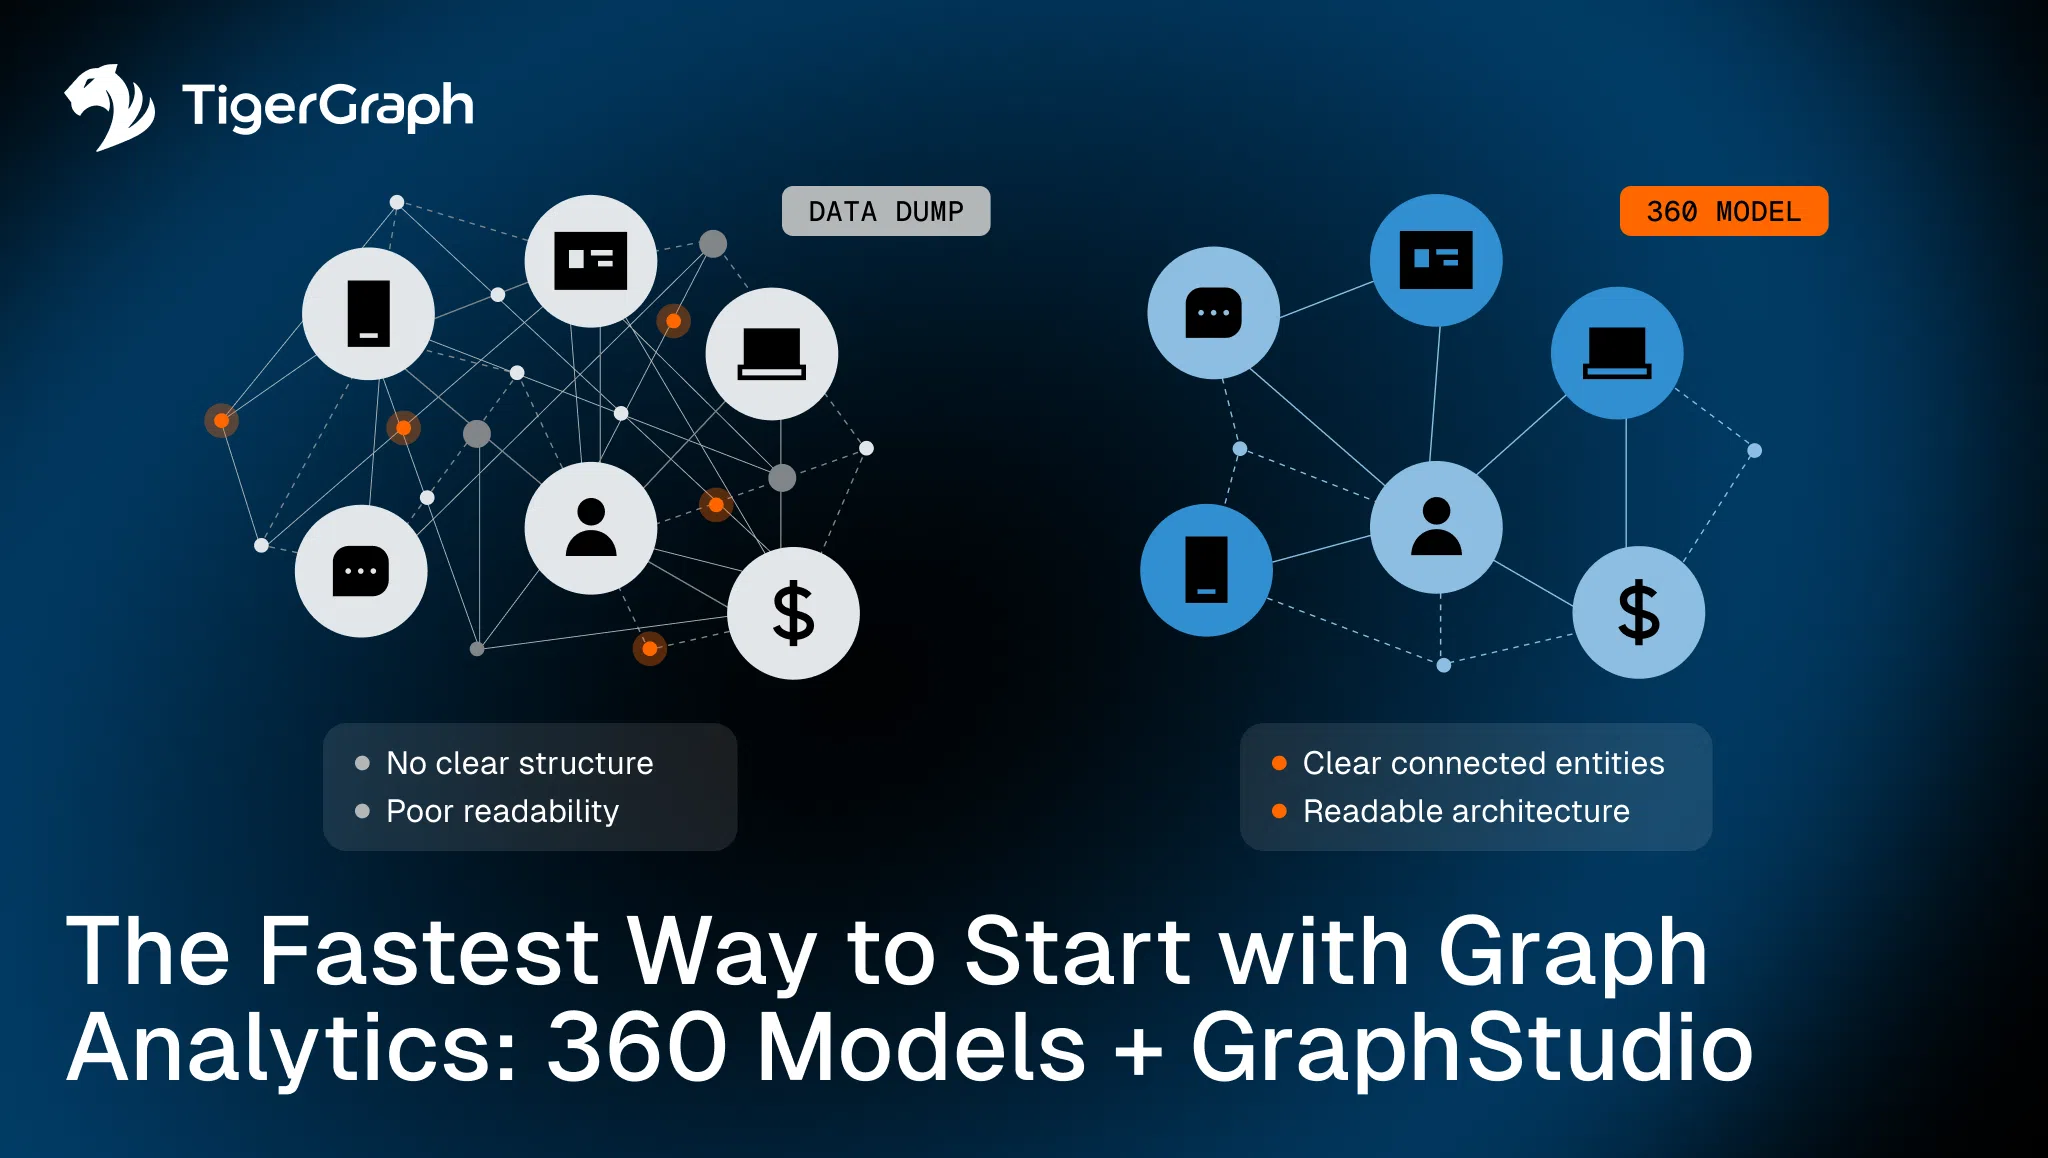
The Common Failure Pattern: Start with a Data Dump
Here is what typically happens: A team decides to explore graph. They export data from multiple systems. They load millions of rows. They define vertices that mirror tables. They create edges based on foreign keys.
The graph technically exists, but when they begin writing queries, the problems surface:
- Traversals return overwhelming result sets
- Relationship direction is inconsistent
- Certain entities should have been separate nodes, but were modeled as properties
- Key identity attributes are duplicated across vertices
- Query logic becomes convoluted to compensate for modeling shortcuts
Now scale becomes the enemy. The larger the graph grows, the more difficult it is to reason about its structure.
This is not a performance issue. It is a modeling issue. And if scaling ambiguity is the root problem, then the solution must reverse the sequence.
The Alternative: Start with a 360 Domain Model
A 360 graph model reverses the process. Instead of loading everything, teams define:
- The primary actors in the system
- The relationships that meaningfully connect them
- The cardinality and direction of those relationships
- The attributes that belong to each entity
- The expected traversal patterns that will drive insight
For example, in a fraud detection context, a contained 360 model might include:
- Customers
- Accounts
- Devices
- IP addresses
- Transactions
- Merchants
Edges would not simply reflect foreign keys. They would represent meaningful behavioral or ownership relationships:
- Customer owns Account
- Account performs Transaction
- Transaction occurs at Merchant
- Device accesses Account
- IP address logs into Account
This is no longer a database schema. It is a behavioral map. Before scaling to billions of events, teams can validate whether:
- Two-hop paths reveal coordinated activity
- Shared devices expose cross-account risk
- Circular transaction paths can be detected cleanly
The graph becomes interpretable before it becomes massive. The shift may seem procedural. In reality, it changes the long-term trajectory of the initiative.
Why 360 Modeling Changes the Economics of Graph
When structure is intentional, several things happen:
- Multi-hop traversal becomes predictable rather than explosive.
- Algorithmic analysis operates on clean relationship definitions.
- Explainability improves because paths reflect business logic.
- Schema changes become evolutionary instead of disruptive.
The difference affects long-term viability. Graph initiatives that start with structure tend to expand confidently. Those that begin with data volume often stall. A strong conceptual model is the starting point. It still needs to be tested.
Using GraphStudio to Validate Before You Scale
Even a strong conceptual model must be tested. GraphStudio provides an interactive environment for schema definition, data ingestion, and traversal exploration. It allows teams to move from whiteboard modeling to executable graph logic in a contained setting.
Within GraphStudio, teams can:
- Define vertex and edge types explicitly
- Configure properties and constraints
- Load representative datasets
- Visualize relationship structures
- Execute and refine multi-hop queries
- Test built-in graph algorithms
This environment creates rapid feedback loops.
- Does a three-hop traversal reflect expected behavior?
- Do certain relationships create unintended fan-out?
- Are identity connections modeled at the correct granularity?
These questions can be answered before the graph expands into production workloads. Validation at this stage reduces the cost of correction later.
Validation also creates confidence, and confidence enables controlled expansion.
From Contained Model to Enterprise Deployment
Once traversal logic is validated, expansion becomes controlled. Teams can integrate additional systems without redefining core entities. They can introduce streaming ingestion without rewriting schema logic. They can scale infrastructure knowing that the structural foundation is stable.
This disciplined expansion prevents:
- Fragmented modeling across departments
- Repeated schema redesigns
- Hidden logical inconsistencies
- Overly complex query workarounds
Scaling becomes additive rather than corrective. Once structural integrity is established, the graph becomes an analytical engine.
Supporting Advanced Algorithms and Connectional Intelligence
With a stable 360 model in place, advanced analysis becomes meaningful.
Graph-native algorithms such as centrality, similarity, community detection, and pathfinding operate directly on structural connectivity. In-graph algorithmic computation preserves relationship depth during analysis.
- In fraud scenarios, this means identifying coordinated behavior rather than isolated anomalies.
- In supply chain resiliency analysis, this means identifying upstream dependency concentration across multiple tiers.
- In identity resolution and KYC contexts, this means linking fragmented profiles through relationship evidence rather than attribute matching alone.
These are connectional problems that require structural coherence. These modeling decisions directly affect enterprise stability.
Why This Matters for Enterprise Teams
Enterprise environments are inherently fragmented. Data exists across silos. Identity is inconsistent, relationships are implicit, and dependencies are poorly documented.
Graph does not remove that complexity. It exposes it.
Starting with a contained 360 model ensures that exposure is intentional. It prevents teams from scaling ambiguity.
TigerGraph’s distributed architecture and support for in-graph algorithms enable deep-link analysis at scale. But architecture alone does not guarantee success. Modeling discipline does.
A Disciplined First Step to Using Graph Analytics
Graph analytics begins with structure. Define the domain, model entities and relationships explicitly, vlidate traversal logic in GraphStudio, and expand deliberately.
When teams begin with structure, graph analytics becomes operational rather than experimental. Clarity precedes scale.
Connect with us today to explore how TigerGraph’s 360 graph modeling approach and GraphStudio environment can help you establish a stable foundation for connectional intelligence at enterprise scale.
Frequently Asked Questions
1. What is a 360 Graph Model And Why is it Critical For Graph Analytics Success?
A 360 graph model defines core entities and relationships upfront, enabling teams to analyze how data connects before scaling—reducing ambiguity and improving insight quality.
2. Why do Graph Projects Fail When Starting With Large-Scale Data Ingestion?
Graph projects fail because loading large volumes of data without a clear model creates inconsistent relationships, poor query performance, and difficult-to-interpret results.
3. How does Early Graph Modeling Improve Time-To-Insight And Reduce Rework?
Early modeling improves time-to-insight by clarifying structure and traversal logic upfront, preventing costly schema changes and rework as the graph scales.
4. What Role does Iterative Validation Play in Building Effective Graph Analytics Solutions?
Iterative validation ensures that relationships, traversal paths, and query logic reflect real-world behavior before scaling, improving accuracy and usability.
5. How can Organizations Scale Graph Analytics Without Introducing Complexity and Inconsistency?
Organizations can scale effectively by starting with a well-defined model, validating structure early, and expanding incrementally—ensuring consistency across systems and use cases.
