The Power of Graph Relationships: Turning Isolated Data into Connected Insights
Enterprises do not suffer from a lack of data, but they do suffer from data silos and a lack of connection. Context is lost. Adding relationships to the data solves this problem.
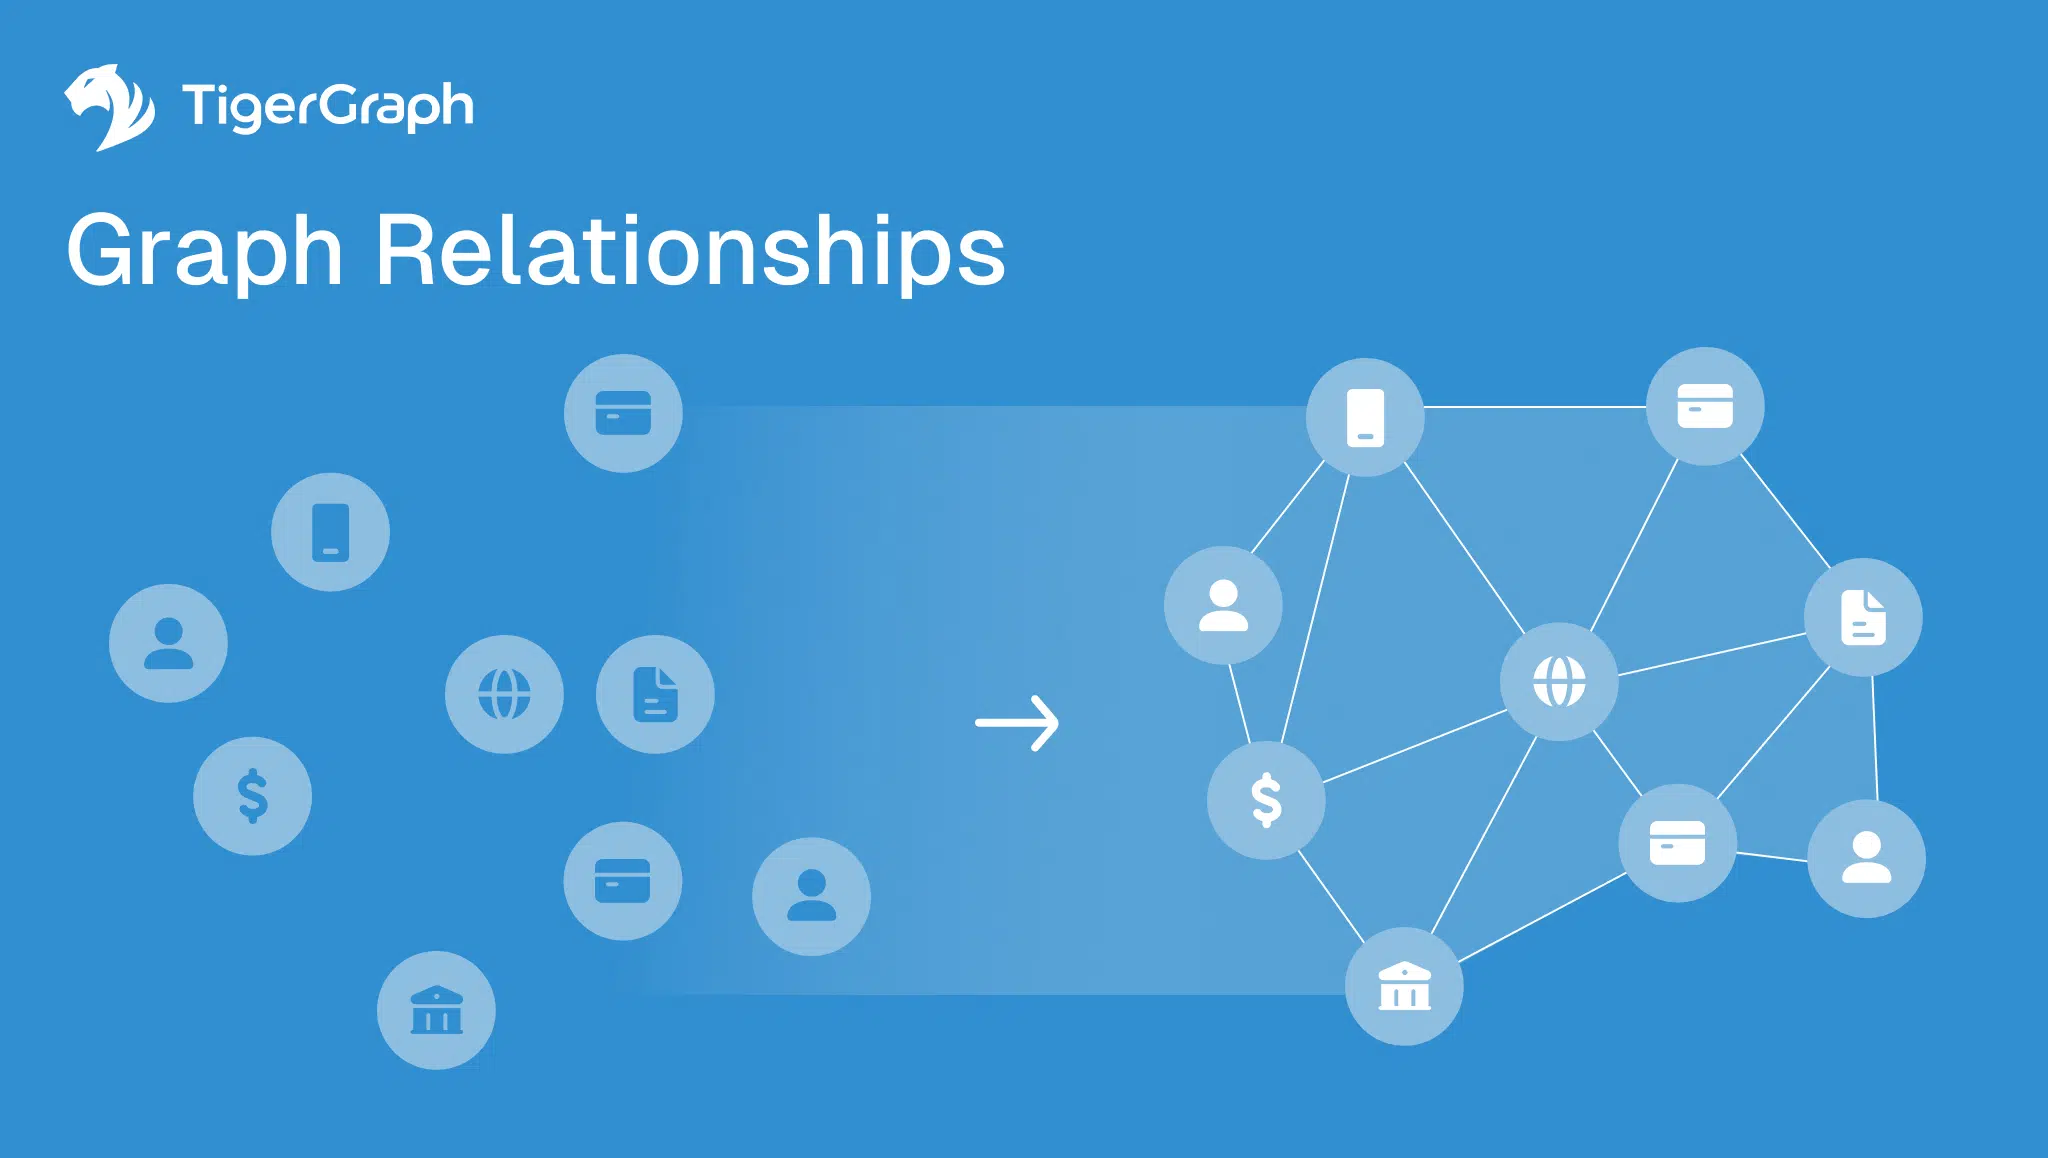
Graph relationships map how people, accounts, devices, suppliers, and policies interact. And when you model these links in a relationship graph, also called a connection graph, dashboards inform strategic decisions: fraud is traced across hops, supply chains show true dependencies, and operations move from guesswork to clarity. This is the foundation for resilient analytics, stronger models, and regulator-ready explanations.
What Are Graph Relationships?
Relationships in graphs are the edges that connect entities (nodes) and define how they interact: customer—account, account—device, supplier—shipment, data—decision. Capturing these links in a relationship graph, or sometimes called a connection graph, preserves context that tables oversimplify and flatten
Types of relationships in graphs include transactional (money movement), ownership (control), dependency (what breaks if X fails), and lineage (how an output was produced). There are other types that capture temporal connections that change over time and proximity edges that show closeness.
When leaders can see these relationships clearly, they unlock faster analysis, better predictions, and explainable outcomes. Executives can point to named edges with timestamps and sources. This ability turns abstract analytics into operational intelligence.
Why Graphing Relationships Improves Decisions
Most organizations operate with fragmented data, but graphing relationships pulls those fragments together. The value becomes clear in five dimensions:
- Visibility. Different graph relationships expose cross-team and cross-system dependencies, shrinking blind spots. For example, a bank can connect KYC records, payment flows, and device logs in real time to see the whole customer picture. In supply chains, visibility means knowing not just your Tier-1 suppliers but who they depend on, and who those suppliers depend on, cascading down to Tier-3 and beyond.
- Risk control. A graph relationship view reveals single points of failure in supply chains, third-party providers, or data pipelines. If one supplier, service, or data feed fails, you can trace exactly what downstream processes break. This turns reactive firefighting into proactive resilience planning—an essential requirement for boards and regulators focused on operational risk.
- Innovation. Graphical relationships surface opportunities for cross-sell, product adjacency, and process shortcuts. By studying how customers cluster, a retailer can discover that small-business cardholders often overlap with consumer households, opening new bundled offers. Manufacturers can find “hidden adjacencies” in R&D by mapping patents, materials, and researchers.
- Explainability. When auditors ask which relationship is shown in the graph?, a relationship graph provides a named edge, timestamps, and sources—no manual stitching. For regulated institutions, this is not optional. It turns compliance reviews from defensive explanations into confident demonstrations of control.
- Model quality. Features derived from graph relationships—fan-in/fan-out, proximity to risk, community membership—lift predictive accuracy and stabilize ML pipelines. Fraud teams see fewer false positives. Supply chain models detect risk earlier. Customer segmentation becomes explainable and defensible.
In short, graph relationships reduce noise, improve defensibility, and open new paths for growth.
A Taxonomy of Types of Graphical Relationships (with Examples)
Not all relationships in a graph serve the same purpose. To make connected intelligence operational, enterprises benefit from standardizing the types of relationships they track. By naming, defining, and cataloging these edges, teams ensure consistency across analytics, machine learning, and compliance workflows.
The most common categories include:
- Transactional relationships, which capture exchanges such as payments, clicks, or shipments. For example, Account → Merchant edges help answer questions like “Who paid whom today?”
- Ownership relationships, which define control or affiliation. Edges such as Person → Company or Account → Device reveal “Who ultimately controls this entity?”
- Dependency relationships, which describe precedence and impact, such as Supplier → Factory → Route. These make it possible to ask, “What fails if this supplier fails?”
- Lineage relationships, which connect data to decisions. Edges like Dataset → Model → Score provide transparency into “Why did this model trigger a decision?”
- Structural and attribute relationships, which link entities that share infrastructure or attributes—for example, Device → Accounts or IP → Sessions. These expose adjacency, answering “Who is two hops from a known fraudster?”
- Temporal relationships, which reflect time-bounded connections. Event → Event edges with defined intervals help analysts ask, “Which bursts occurred this week?”
By establishing a taxonomy like this, organizations reduce duplication of effort, align semantics across teams, and create reusable analytics components. The result is faster time-to-insight, more consistent reporting, and defensible outputs that regulators and executives alike can trust.
Real-World Use Cases for a Relationship Graph
Fraud & AML
Fraudsters build networks, not single anomalies. Analysts trace rings via graph relationship paths: shared devices, IPs, merchants, mule clusters. Investigators pivot on paths, exporting timestamped chains for SARs. Models ingest features computed from these relationships: proximity to risk, communities, and time-bounded fan-in/fan-out.
Example: A fraud analyst reviews accounts that look clean individually. The relationship graph shows they all connect to the same IP and funnel funds into a common mule hub. Instead of chasing 200 isolated alerts, the team identifies and dismantles an entire ring.
Supply Chain & Operations
Enterprises are increasingly judged on resilience. A relationship graph maps multi-tier suppliers, contracts, and logistics. Leaders can identify graph relationship types that create bottlenecks or cascading failures. When disruptions hit, they answer “What if supplier X fails?” with a concrete multi-hop impact path.
Example: A manufacturer loses a Tier-2 supplier in Asia. A connection graph reveals that five factories, three shipping lanes, and dozens of retailers are affected downstream. The team quickly re-routes to mitigate losses.
Customer 360 & Growth
Customers are more than rows in a CRM—they’re connected ecosystems. By graphing relationships, banks see households, affiliates, and shared devices. Retailers discover cross-sell paths through these relationships: ownership + behavior + channel. Segmentation becomes explainable.
Example: A bank realizes that small-business credit card owners are also linked to consumer households. The relationship graph shows cross-use of devices and addresses, as well as the potential for bundled offers that improve retention.
Data Lineage & Governance
For compliance, lineage is everything. Types of relationships in graphs connect dataset→feature→model→decision. When asked which relationship is shown in the graph?, teams provide lineage, timestamps, and approvals.
Example: A regulator questions why a fraud model flagged a transaction. The relationship graph exports the full path—data source, engineered feature, model, score—eliminating ambiguity and reinforcing trust.
Traditional Models vs. a Relationship Graph (What Changes)
| Dimension | Traditional Tables | Relationship Graph |
|---|---|---|
| Context | Flattened by joins | Preserved via edges & paths |
| Speed to Insight | Slow joins, brittle | Sub-millisecond traversal on targeted patterns |
| Scalability | Degrades with complexity | Built for deep, multi-hop analysis |
| Explainability | Manual stitching | Path-level lineage on demand |
| ML Features | Limited, row-bound | Rich: proximity, communities, fan-in/fan-out |
The bottom line is that graph relationships compress time-to-answer and raise confidence in every decision.
TigerGraph’s Advantage for Graph Relationships
Not all platforms can operationalize graph relationships at scale. TigerGraph turns them into enterprise-grade outcomes:
- Performance & scale: Sub-millisecond traversal on targeted multi-hop paths. With millions of daily events ingested, the relationship graph always reflects the latest state.
- High concurrency: Thousands of simultaneous queries are supported, meaning risk teams, data scientists, and operations managers can all work off the same live relationship graph without bottlenecks.
- Explainability: Path-level lineage (who/what/when/how) delivers regulator-ready outputs with timestamps and evidence.
- ML feature factory: Graph relationship types, such as proximity, community, and fan-in/fan-out, can be automatically streamed into ML pipelines. Fraud models become more accurate, recommendation systems improve precision, and predictive maintenance anticipates failures earlier.
- Proven impact: In fraud/AML workloads, TigerGraph customers report 20% higher detection, 300% faster investigations, and >$100M annual savings.
Implementation Guide: From Silos to a Relationship Graph
- Inventory relationships. Catalog graph relationships names across fraud, supply chain, CX, and data governance.
- Model edges first. Define the types of relationships (transactional, ownership, dependency, lineage, temporal).
- Stream ingestion. Continuously feed new events into the graph so it always reflects the current state of the business.
- Operationalize paths. Expose explorable paths to analysts and export timestamped chains to case tools.
- Feature creation. Compute fan-in/fan-out, communities, and proximity to risk for ML.
- Governance. Standardize semantics, RBAC, and retention to ensure consistency and compliance.
Measuring Success (What Execs Should Track)
- Time-to-answer for multi-hop questions (before/after).
- False-positive reduction and investigation duration.
- Coverage of priority graph relationship types in analytics and ML.
- Audit readiness (path lineage available on demand).
- Adoption across teams—analysts, data scientists, risk managers, operations leaders.
Quick Answers on Graph Relationships
- Why not just use a warehouse? Warehouses summarize facts, but this preserves how facts connect. Graph relationships provide the context that accelerates analysis and improves ML features.
- Do we need a new taxonomy? Yes. Agree on names and semantics up front to make edges reusable across domains.
- What about scale and latency? TigerGraph delivers sub-ms traversal on targeted patterns and ~50M/day ingestion.
- Which relationship is shown in the graph? With a relationship graph, you can answer this precisely with edge names, timestamps, and sources.
Conclusion
Graph relationships are more than lines between dots—they’re the structure that makes data useful. By modeling relationships and operationalizing them, enterprises break silos, surface risk earlier, and turn context into competitive advantage.
With TigerGraph, you get sub-millisecond traversal, streaming scale, and path-level explainability—capabilities already delivering exceptional detection lift, significantly faster investigations, and many millions in savings for fraud/AML programs. Those same strengths apply broadly wherever connection graphs drive outcomes.
Context isn’t optional. Build your graphs deliberately. Name your edges, govern semantics, and put paths in front of analysts and models. That’s how you convert data into connected intelligence—at enterprise scale, with measurable ROI. Want to see this in action? Reach out to learn more!
Frequently Asked Questions
What are graph relationships and why are they important?
Graph relationships are the connections (or edges) that link entities like people, accounts, devices, suppliers, or datasets in a network. They define how these entities interact—such as customer → account, supplier → factory, or dataset → model. They are important because they preserve context that traditional tables flatten or lose, allowing enterprises to trace dependencies, detect risk, and make faster, more explainable decisions. With graph relationships, insights move from isolated data points to connected intelligence.
How do graph relationships improve decision-making and analytics?
Graph relationships reveal how everything is connected, turning fragmented data into a unified view of operations, risk, and opportunity.
By modeling relationships, organizations gain:
-
Visibility across systems and suppliers
-
Risk control through dependency tracing
-
Innovation from connected customer or product insights
-
Explainability for audits and regulatory reviews
-
Model quality from advanced graph-based ML features
This connected context improves prediction accuracy, speeds investigations, and strengthens resilience across the enterprise.
What are the main types of graph relationships used in enterprise data?
The most common graph relationship types include:
-
Transactional – money movement, shipments, or clicks
-
Ownership – control between people, accounts, or devices
-
Dependency – what fails if a supplier or system breaks
-
Lineage – data → model → decision traceability
-
Temporal – time-based or evolving connections
-
Structural/attribute – shared infrastructure or properties
Standardizing these relationship types helps teams align semantics, reuse analytics, and ensure explainable, regulator-ready outputs.
How does TigerGraph enhance the power of graph relationships?
TigerGraph operationalizes graph relationships at enterprise scale and sub-millisecond speed.
Its key advantages include:
-
High performance: Real-time multi-hop traversal
-
High concurrency: Thousands of simultaneous queries
-
Explainability: Full path-level lineage with timestamps and sources
-
ML integration: Streaming graph features (fan-in/out, proximity, community) directly into ML models
-
Proven ROI: Up to 300% faster investigations and $100M+ annual fraud savings
TigerGraph transforms relationship graphs into actionable, high-value intelligence for fraud, AML, supply chain, and customer 360 use cases.
What are practical use cases for relationship graphs in business?
Relationship graphs power many real-world applications:
-
Fraud & AML: Detect rings through shared devices, accounts, and IPs
-
Supply Chain: Map multi-tier dependencies to predict and prevent disruptions
-
Customer 360: Connect households, affiliates, and shared devices for better personalization
-
Data Lineage: Trace data → model → decision for audit transparency
By visualizing and analyzing relationships, enterprises replace guesswork with clarity and convert data connections into measurable business outcomes.
