Time-Aware Graphs: Solving Temporal Risk in AML
The AML problem isn’t static, and your graph can’t be either.
Money laundering doesn’t follow neat rows in a spreadsheet. It mutates over time. A series of deposits just under reporting thresholds may appear benign until you notice they always occur right before the cutoff windows. Layering schemes weave across accounts and intermediaries, sometimes stretching over weeks. Dormant accounts suddenly reawaken to act as pass-throughs for suspicious flows.
Flat models treat each of these events as isolated. The result is a fragmented picture in which risky behavior looks ordinary, allowing illicit funds to slip through undetected.
Why Flat Models Miss Temporal Risk
Flat models miss the big picture, but more importantly, they miss the dimension of change itself. They score transactions as isolated rows, stripped of sequence and timing.
A $5,000 transfer may appear safe when viewed alone, but if it’s the third hop in a five-step cycle compressed into 36 hours, the story is very different. Without temporal awareness, the model fails to recognize how ordinary activity becomes suspicious when it accelerates, repeats, or aligns with known laundering tactics.
Batch processing makes this worse. Daily or weekly lookbacks create artificial windows that distort the picture.
Short windows overlook the slow-burn schemes that launder money over weeks or months, while long windows introduce too much noise and bury the signals in irrelevant activity. Either way, patterns emerge too late, if at all.
The consequences become clear when regulators demand a timeline. Investigators are expected to explain not only what happened but when and in what order.
Flat systems can’t deliver that directly, so analysts are left to manually stitch together spreadsheets, logs, and case notes to recreate a narrative that should have been visible from the start. It’s slow, error-prone, and undermines regulator confidence in the bank’s monitoring program.
Ultimately, without treating time as a first-class feature of the data model, risk detection is always reactive. Institutions are left responding after suspicious behavior has already occurred, rather than catching laundering rings or structuring bursts in the act.
Making Time First-Class with a Graph
A time-aware graph connects entities through time. Every relationship carries timestamps, validity ranges, and recency markers that allow analysts to see how behavior unfolds. Instead of reassembling events from disconnected tables, teams query a living structure: “show me every transfer between these accounts in the last 48 hours,” or “give me a rolling 14-day view.”
This eliminates guesswork about when a relationship began, how long it persisted, or whether it intensified or decayed. By elevating time to a core property, compliance teams gain the ability to distinguish normal activity from suspicious evolution.
Patterns themselves become reusable features. Rhythmic bursts of small deposits, devices that reappear across seemingly unrelated accounts, or oscillating transaction sizes that repeat with uncanny regularity all stand out as time-based motifs. These patterns are baked directly into the graph model, making them available to both investigators and machine learning models in real time.
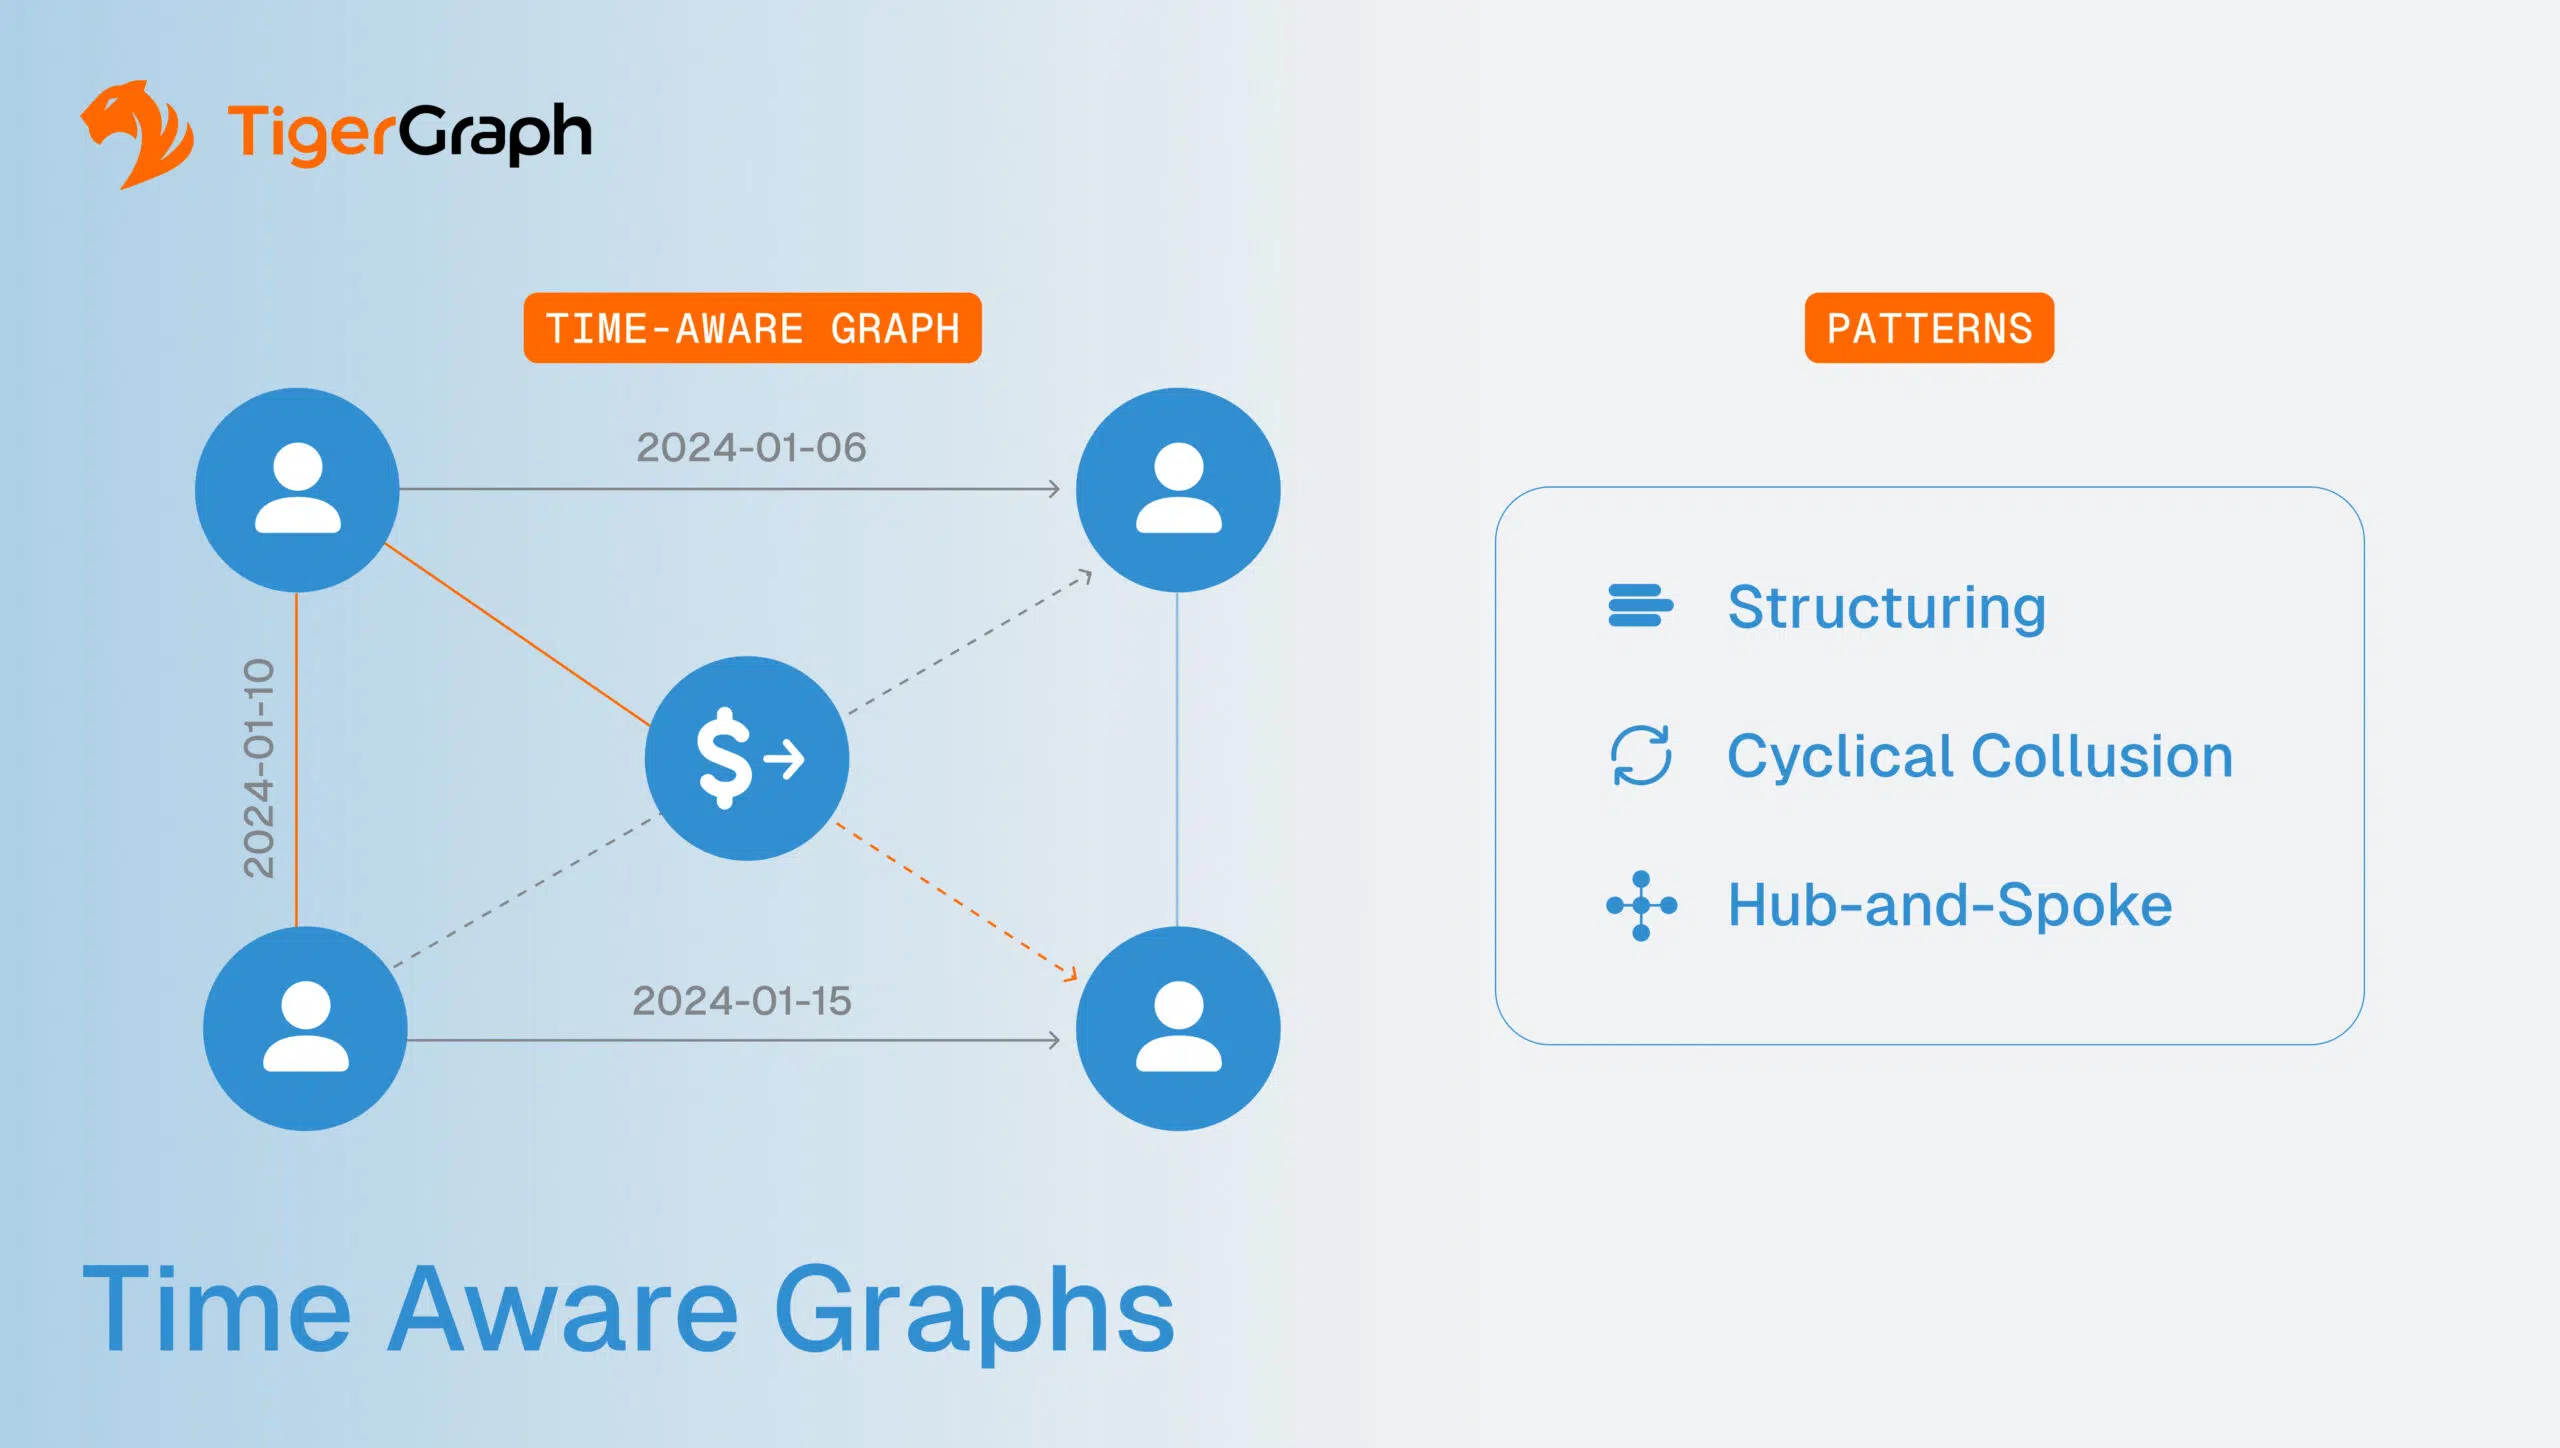
Patterns That Become Straightforward in a Time-Aware Graph
When time is embedded in the model, schemes that once took weeks of manual reconstruction become instantly visible.
Structuring, for example, appears as a tightly clustered pattern of sub-threshold deposits right before reporting deadlines. Cyclical collusion between merchants and cardholders shows up as synchronized spend-and-return cycles that repeat over nights or weekends.
Laundering rings that rely on rapid pass-throughs are revealed by hub-and-spoke patterns where short-lived accounts fan out through shared devices or IP addresses before vanishing. Even trust erosion can be quantified: an account that was “clean” last week can suddenly appear just one or two hops from a newly sanctioned entity today. These are exactly the kinds of dynamics regulators expect banks to detect and document, but which flat models consistently miss.
What Changes for the AML Operating Model
Embedding time into graphs sharpens detection and reshapes the daily workflow of AML teams.
Investigations shift from batch-driven lookbacks to continuous monitoring, where risks are surfaced as they form rather than after the fact. Rules are no longer hard-coded to static thresholds but evolve into recurring signals that fire automatically as the graph grows into those shapes.
Explainability also transforms. Instead of piecing together spreadsheets and logs, analysts can pull a complete, timestamped path from the graph in seconds.
Suspicious Activity Reports that once required days of evidence gathering can be drafted with defensible lineage already attached. For compliance leaders, this means faster reporting, fewer backlogs, and a stronger position in regulatory examinations.
How TigerGraph Operationalizes Temporal AML Analytics
TigerGraph makes this conceptual model operational at enterprise scale. Its native traversal engine supports sub-millisecond queries even across multi-hop, time-sensitive paths. This allows analysts to test hypotheses interactively rather than waiting for batch jobs to complete.
High-throughput ingestion keeps pace with the real world, streaming in roughly 50 million events per day, including transactions, sanctions updates, KYC refreshes, and alerts, so the graph always reflects the current state. Each edge is stamped with time properties, meaning investigators can export not just who and what, but also when and in what sequence.
For data scientists, TigerGraph acts as a feature factory. Time-weighted centrality scores, burstiness measures, and “distance to risk within N hours” can all be generated directly from the graph and piped into machine learning pipelines. The result is stronger models, faster investigations, and regulator-ready transparency in a single platform.
Time-aware graphs turn AML monitoring from a reactive process into a proactive safeguard.
With sub-millisecond traversal and ~50M daily events ingested, TigerGraph enables teams to detect not just that suspicious behavior exists, but when it begins to form. The result is fewer false positives, faster SAR preparation, and explainable narratives that withstand regulatory scrutiny. And it happens without requiring banks to rip out and rebuild existing compliance infrastructure.
AML isn’t slowing down, and neither can detection. Time-aware graphs are increasingly being adopted at Tier-1 scale to reduce false positives, accelerate SARs, and deliver regulator-ready transparency. The question isn’t if you’ll adopt temporal intelligence, but rather, how quickly you’ll embed it. TigerGraph is ready to help you start.
