Time Series Database Fundamentals in Modern Analytics
A time series database organizes data by timestamp and captures how values evolve across continuous intervals. It is a core component of monitoring, forecasting, and large-scale operational analysis.
This article describes how time series databases function, where they perform best, and where they require additional context, and it explains how TigerGraph’s graph architecture strengthens temporal insight in modern digital environments.
What Is a Time Series Database?
A time series database (TSDB) is optimized for collecting, indexing, and querying data points that arrive in chronological order. It is designed to handle high-ingest workloads, time-based queries, and continuous measurements such as sensor data, financial metrics, and application logs.
The purpose of a TSDB is to deliver efficient storage, predictable query performance, and rapid retrieval of recent values.
Time-oriented workloads are common across industries, and TSDBs provide stable indexing mechanisms for timestamp-based operations. They also offer compression strategies, retention policies, and functions for downsampling or aggregating large time windows.
A time series db succeeds when the primary question concerns rate, frequency, patterns of change or anomalies over time.
Time Series Database Architecture
A time series database architecture is built for speed, order and predictability. Its core design centers on writing data as fast as it arrives and keeping everything aligned by time. Most systems share a few common components.
They use a write-ahead log to protect data integrity and break storage into time-partitioned segments. This way, queries can scan only what they need. They rely on in-memory buffers to handle bursts of incoming measurements and they also maintain index structures designed specifically for time-based filtering.
Together, this architecture supports metrics at scale and enables queries that filter by temperature ranges, throughput trends, or event frequency during specific intervals.
A well-designed time-series database can maintain performance even as data volumes rapidly increase.
What Is Time Series Database Logic Used For?
Understanding how time series database logic behaves is essential for analysts responsible for workloads in which the primary signal is change over time. A time series database supports several core functions that appear across modern operational systems:
- Monitoring continuous system activity where each measurement must be recorded, compared, and queried in chronological order.
- Forecasting recurring or seasonal patterns where historical sequences provide the basis for predictive models.
- Alerting on threshold breaches by evaluating real-time metrics against baselines, service-level requirements or anomaly bands.
- Capturing and contextualizing historical performance so teams can analyze degradation, peak load behavior, and long-term operational trends.
A TSDB is effective in environments where measurements arrive at high frequency and where the time dimension dictates both the meaning of the data and the correct analytical method.
Common examples include:
- IoT telemetry streams
- Payment and authorization volumes
- Application performance monitoring
- Financial ticks
- Industrial sensor output
- Energy or utility grid measurements
These systems depend on accurate timestamp ordering, efficient ingestion, and rapid retrieval of recent and historical values, which a time series database is designed to handle.
Comparing Time Series Databases and Relational Systems
Traditional relational systems can store historical values but are not optimized for sequential writes, retention management, or high-volume ingest of temporal data. A database for time series data avoids index contention and provides purpose-built aggregation functions.
Key distinctions include:
| Capability | Relational Database | Time Series Database |
|---|---|---|
| Write optimization | General purpose | Sequential, high-ingest |
| Time indexing | Secondary feature | Primary design |
| Compression | Row-based | Time-based |
| Retention policies | Manual | Automatic and native |
Each system plays a role. A database for time series analysis functions best when time itself is the dominant query dimension.
Common Time Series Database Use Cases
A time series database is applied across a wide range of operational and analytical workloads because many modern systems generate high-frequency, time-dependent measurements. These environments depend on accurate temporal ordering, efficient storage of sequential data, and rapid retrieval of both recent and historical values.
Representative time series database use cases include:
- Application and infrastructure monitoring. TSDBs record CPU load, memory utilization, network throughput, error counts and service latency at varying intervals. This supports diagnostics, capacity planning and incident response.
• Predictive maintenance. Industrial equipment emits continuous sensor data. A TSDB captures temperature, vibration, pressure, and duty-cycle metrics so teams can detect drift, identify early signs of component fatigue, and plan maintenance before failure occurs.
• Financial market telemetry. A time series database organizes financial markets’ stock, trade and order streams to support risk modeling, microstructure analysis and regulatory reporting.
• Energy consumption and grid performance. Utilities track voltage, frequency, load shifts, renewable output, and demand cycles. TSDBs store these sequences to support grid balancing, optimization, and long-term planning.
• Manufacturing sensor analysis. Production lines track each stage with high-resolution measurements. A TSDB enables analysis of throughput, fault signatures, environmental conditions and process variation across repeated cycles.
Taken together, these time series database use cases demonstrate why TSDBs remain fundamental to modern digital operations. They provide a reliable substrate for systems facing continuous change, and where observations need to happen at scale. The time dimension defines both the structure of the data and the meaning extracted from it.
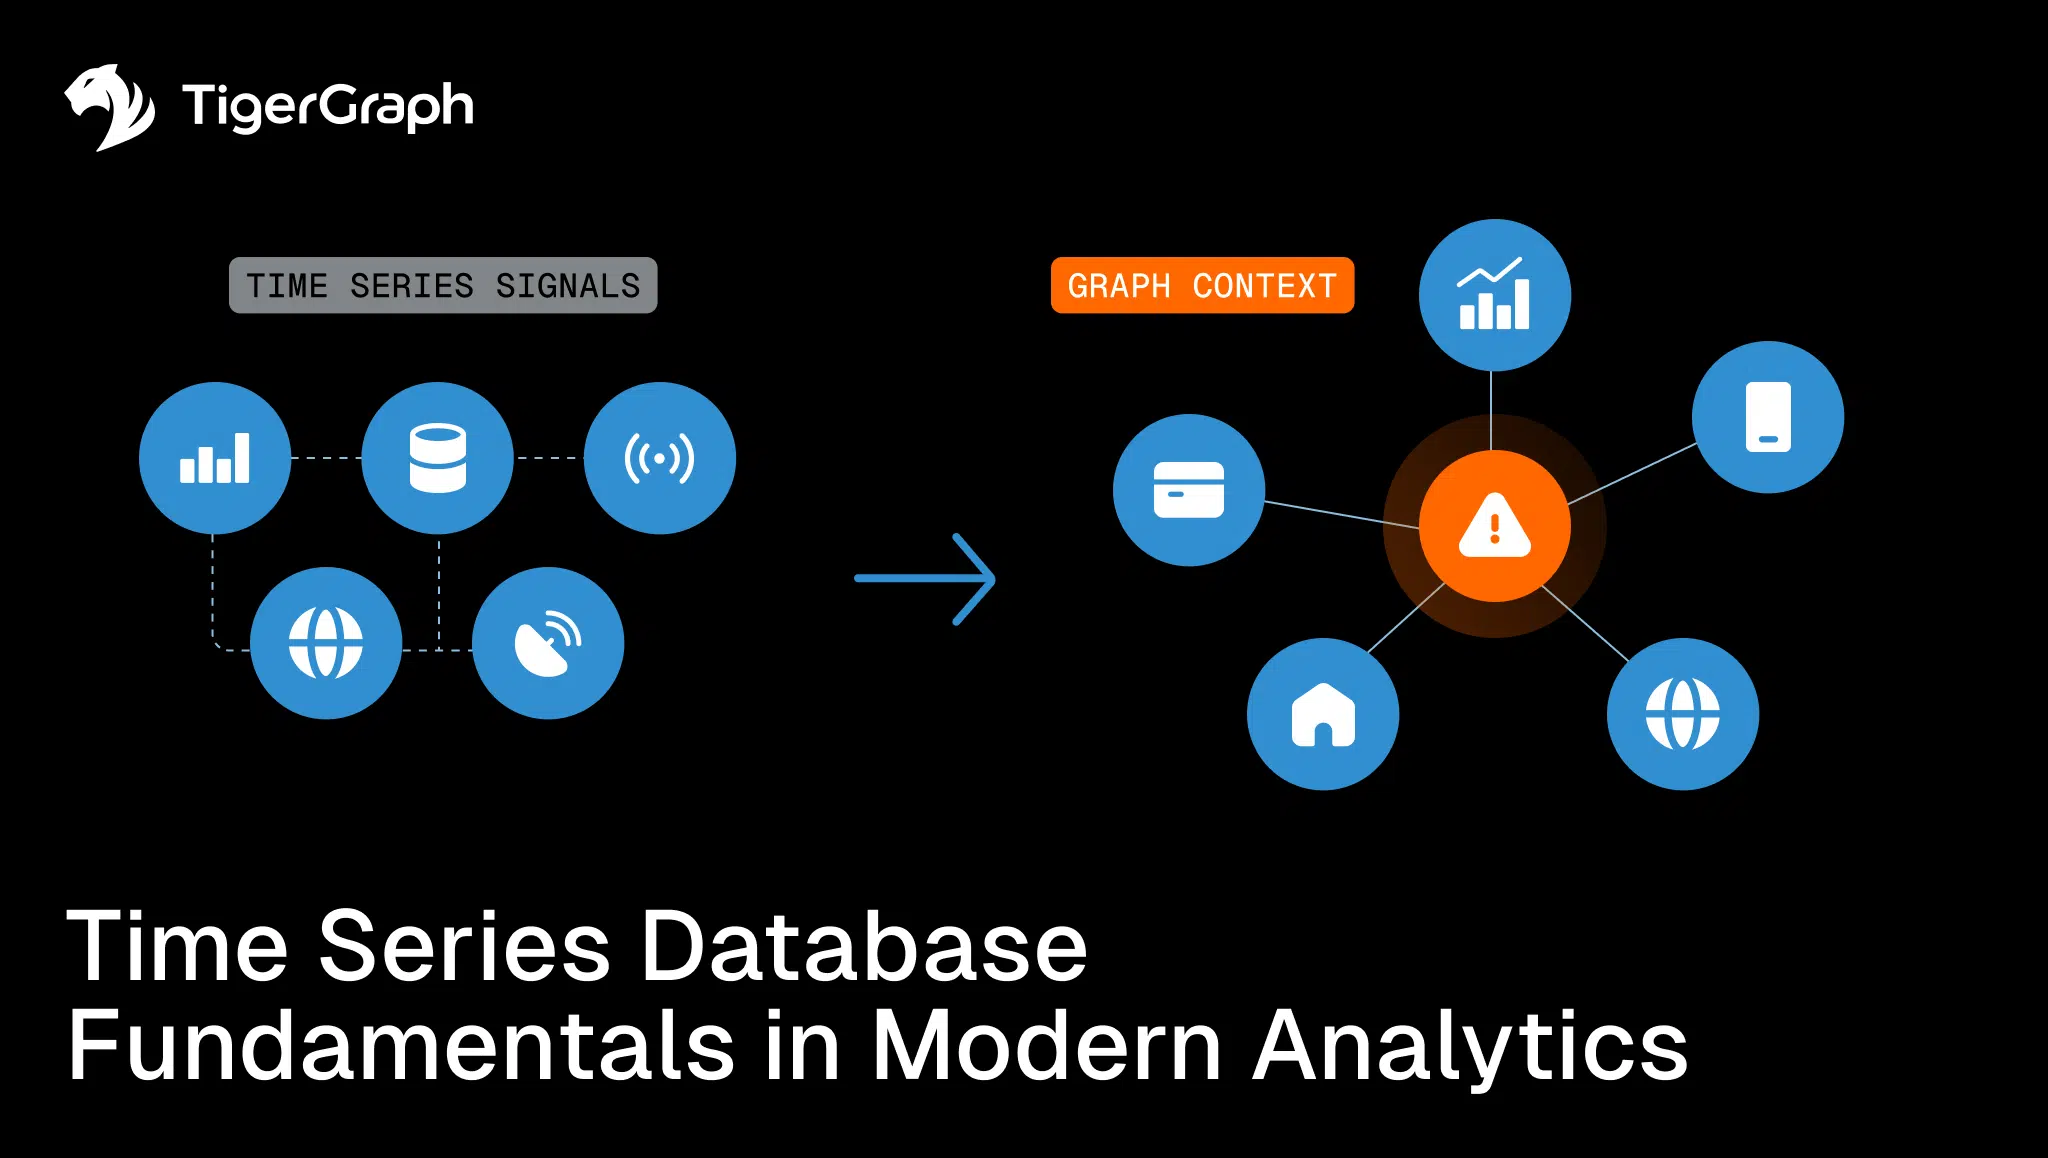
When do Graph Databases Add Essential Context?
A TSDB excels at “when” something happened, but not “why.” Relationships across devices, accounts, equipment or systems often determine the root cause of temporal spikes. Graph databases reveal these dependencies.
TigerGraph supports enterprise workloads that require structural insight around time-indexed data.
The graph captures entities, their relationships and their propagation pathways. Influences that cannot be extracted from sequential metrics alone are revealed when it’s paired with temporal values.
- Fault propagation and equipment hierarchies. A temperature spike in one component may influence adjacent subsystems, alter downstream performance or mask the true point of origin. Time series data shows when the anomaly occurred, but the graph model clarifies how it spread through the hierarchy.
• User behavior across multi-step digital journeys. A sequence of clicks, searches, or service requests has temporal meaning, yet the relationships between users, devices, sessions, and content determine why the behavior emerges. Graph connects these entities so analysts can interpret paths rather than isolated events.
• Transaction relationships that signal correlated risk. Suspicious activity often appears only when individual time-stamped events are linked across shared accounts, devices, merchants or locations. The TSDB captures each transaction and the graph exposes the relational pattern formed by their connections.
• Sensor networks that share common upstream dependencies. Distributed sensors report anomalies that are determined based on shared infrastructure, geographic proximity and environmental factors. A graph reveals these dependency structures, making temporal trend interpretation possible.
When these patterns depend on both time and relationships, TigerGraph’s architecture provides a complementary layer of reasoning.
The platform processes multi-hop paths in real time. It allows analysts to integrate chronological trends with structural insight and produce explanations that reflect the full system rather than a single sequence of readings.
Time Series Data Management in Graph-Integrated Environments
Many organizations pair a time series database with a graph system so they can see both the sequence of events and the structure behind them. This combination improves forecasting and makes root-cause analysis more precise.
To get the best results, teams should consider these steps when planning:
- Store timestamps directly on edges that represent time-based relationships
- Use graph traversal to compare how patterns shift across different periods
- Maintain separate retention rules for raw time-series metrics and graph metadata
- Apply graph analytics to uncover correlations across devices, entities or operational processes
This keeps the time dimension and the relationship dimension in balance, which is essential for understanding how complex systems behave.
How to Choose the Best Time Series Database Strategy?
Analysts selecting the best time series database strategy evaluate ingestion rate, retention requirements, compression techniques and analytical workloads. A TSDB should handle the temporal dimension, while TigerGraph complements it with reasoning across connected entities.
When evaluating the best database for time series data, enterprise teams may want to prioritize consistent ingest at high volumes, efficient range queries and clear retention controls. Interoperability with graph systems is also important.
The architecture should support historical measurement and connected insight.
Time Series Database Examples
Common time series database examples include:
- Application performance metrics
- Sensor readings
- Market quotes
- Machine state transitions
- Customer interaction timelines
They illustrate how sequential measurements support observation. TigerGraph then provides the structural framework that explains how these sequences influence one another.
Benefits of a Hybrid Graph and Time Series Model
Pairing TSDBs with graph reasoning delivers a unified analytical model. Time series engines show change. Graph engines show dependency. Together they form a complete workflow for anomaly detection, forecasting, and operational intelligence.
TigerGraph is a database graph provider that supports high-load enterprise workloads, provides industry-specific solutions, and offers the performance required by modern digital businesses. Its architecture evaluates multi-hop structure in real time and maintains schema clarity across applications. This makes it a strong complement to TSDB environments.
Summary
A time series database is essential for measuring change over time, but structure determines why those changes occur. Time-oriented metrics gain interpretive power when combined with TigerGraph’s high-performance graph capabilities.
Together they provide the chronology, dependency analysis, and operational insight required for modern analytics across finance, supply chain, manufacturing, energy, and digital platforms.
Ready to strengthen your time-series analytics?
Explore how TigerGraph complements your existing time series database strategy with real-time multi-hop reasoning, high-performance traversal, and schema clarity designed for complex enterprise environments.
Visit TigerGraph to evaluate solutions, review industry use cases, and determine the next step for your architecture.
Frequently Asked Questions
1. Why do organizations struggle to get full insight using only a time series database?
Many organizations find that while a TSDB tells them when changes occur, it cannot explain why they occur. Time-ordered metrics lack relational context—such as upstream dependencies, cross-entity interactions, or multi-step behaviors—which are often the true cause of anomalies, spikes, or unusual trends. This is why enterprises increasingly combine TSDBs with graph analytics to reveal hidden connections behind temporal patterns.
2. How does combining graph analytics with time series data improve root-cause analysis?
Graph analytics maps relationships across systems, devices, transactions, and users. When paired with timestamped data, this offers a 360° view of incident propagation. Instead of analyzing isolated events, teams can trace multi-hop dependencies, discover cascading failures, detect correlated risks, and identify the real point of origin behind time-based anomalies—something TSDBs cannot do alone.
3. What should enterprises evaluate when choosing a long-term strategy for time series intelligence?
Beyond ingest rate and query performance, enterprises must consider interoperability with contextual data sources, support for relationship reasoning, multi-hop traversal capabilities, and flexibility in handling hybrid analytical workloads. The best long-term strategy includes both temporal insight (from a TSDB) and structural insight (from a graph platform such as TigerGraph).
4. How do time series data and graph data complement each other in operational systems?
Time series data captures sequential change, while graph data captures interconnected structure. When combined, they enable richer analytics such as behavioral journey mapping, dependency-aware forecasts, coordinated anomaly detection, and system-wide intelligence. TSDBs answer “what changed and when,” while graph systems answer “how components interact and why the change occurred.”
5. What industries benefit the most from integrating graph analytics with their time series platforms?
Industries with complex, interconnected systems benefit most—including finance, manufacturing, energy, telecom, logistics, and digital platforms. These environments depend on continuous measurement, but also require visibility into relationships like supply dependencies, account linkages, device hierarchies, customer journeys, or sensor networks. Graph + time series integration delivers real-time insights, faster diagnosis, and more accurate prediction across these sectors.
