Why Graph Centrality Measures Detect Fraud Faster
Fraud hides in the connections between people, accounts, merchants, and devices. It spreads quietly until the losses add up. Traditional fraud detection tools look for anomalies in transactions, but they miss which entities matter most in a fraud network. This is why fraud network analysis powered by graph analytics for financial crime is essential for modern banks.
And this is where graph centrality measures come in, enabling precise entity centrality banking analysis to prioritize risk nodes.
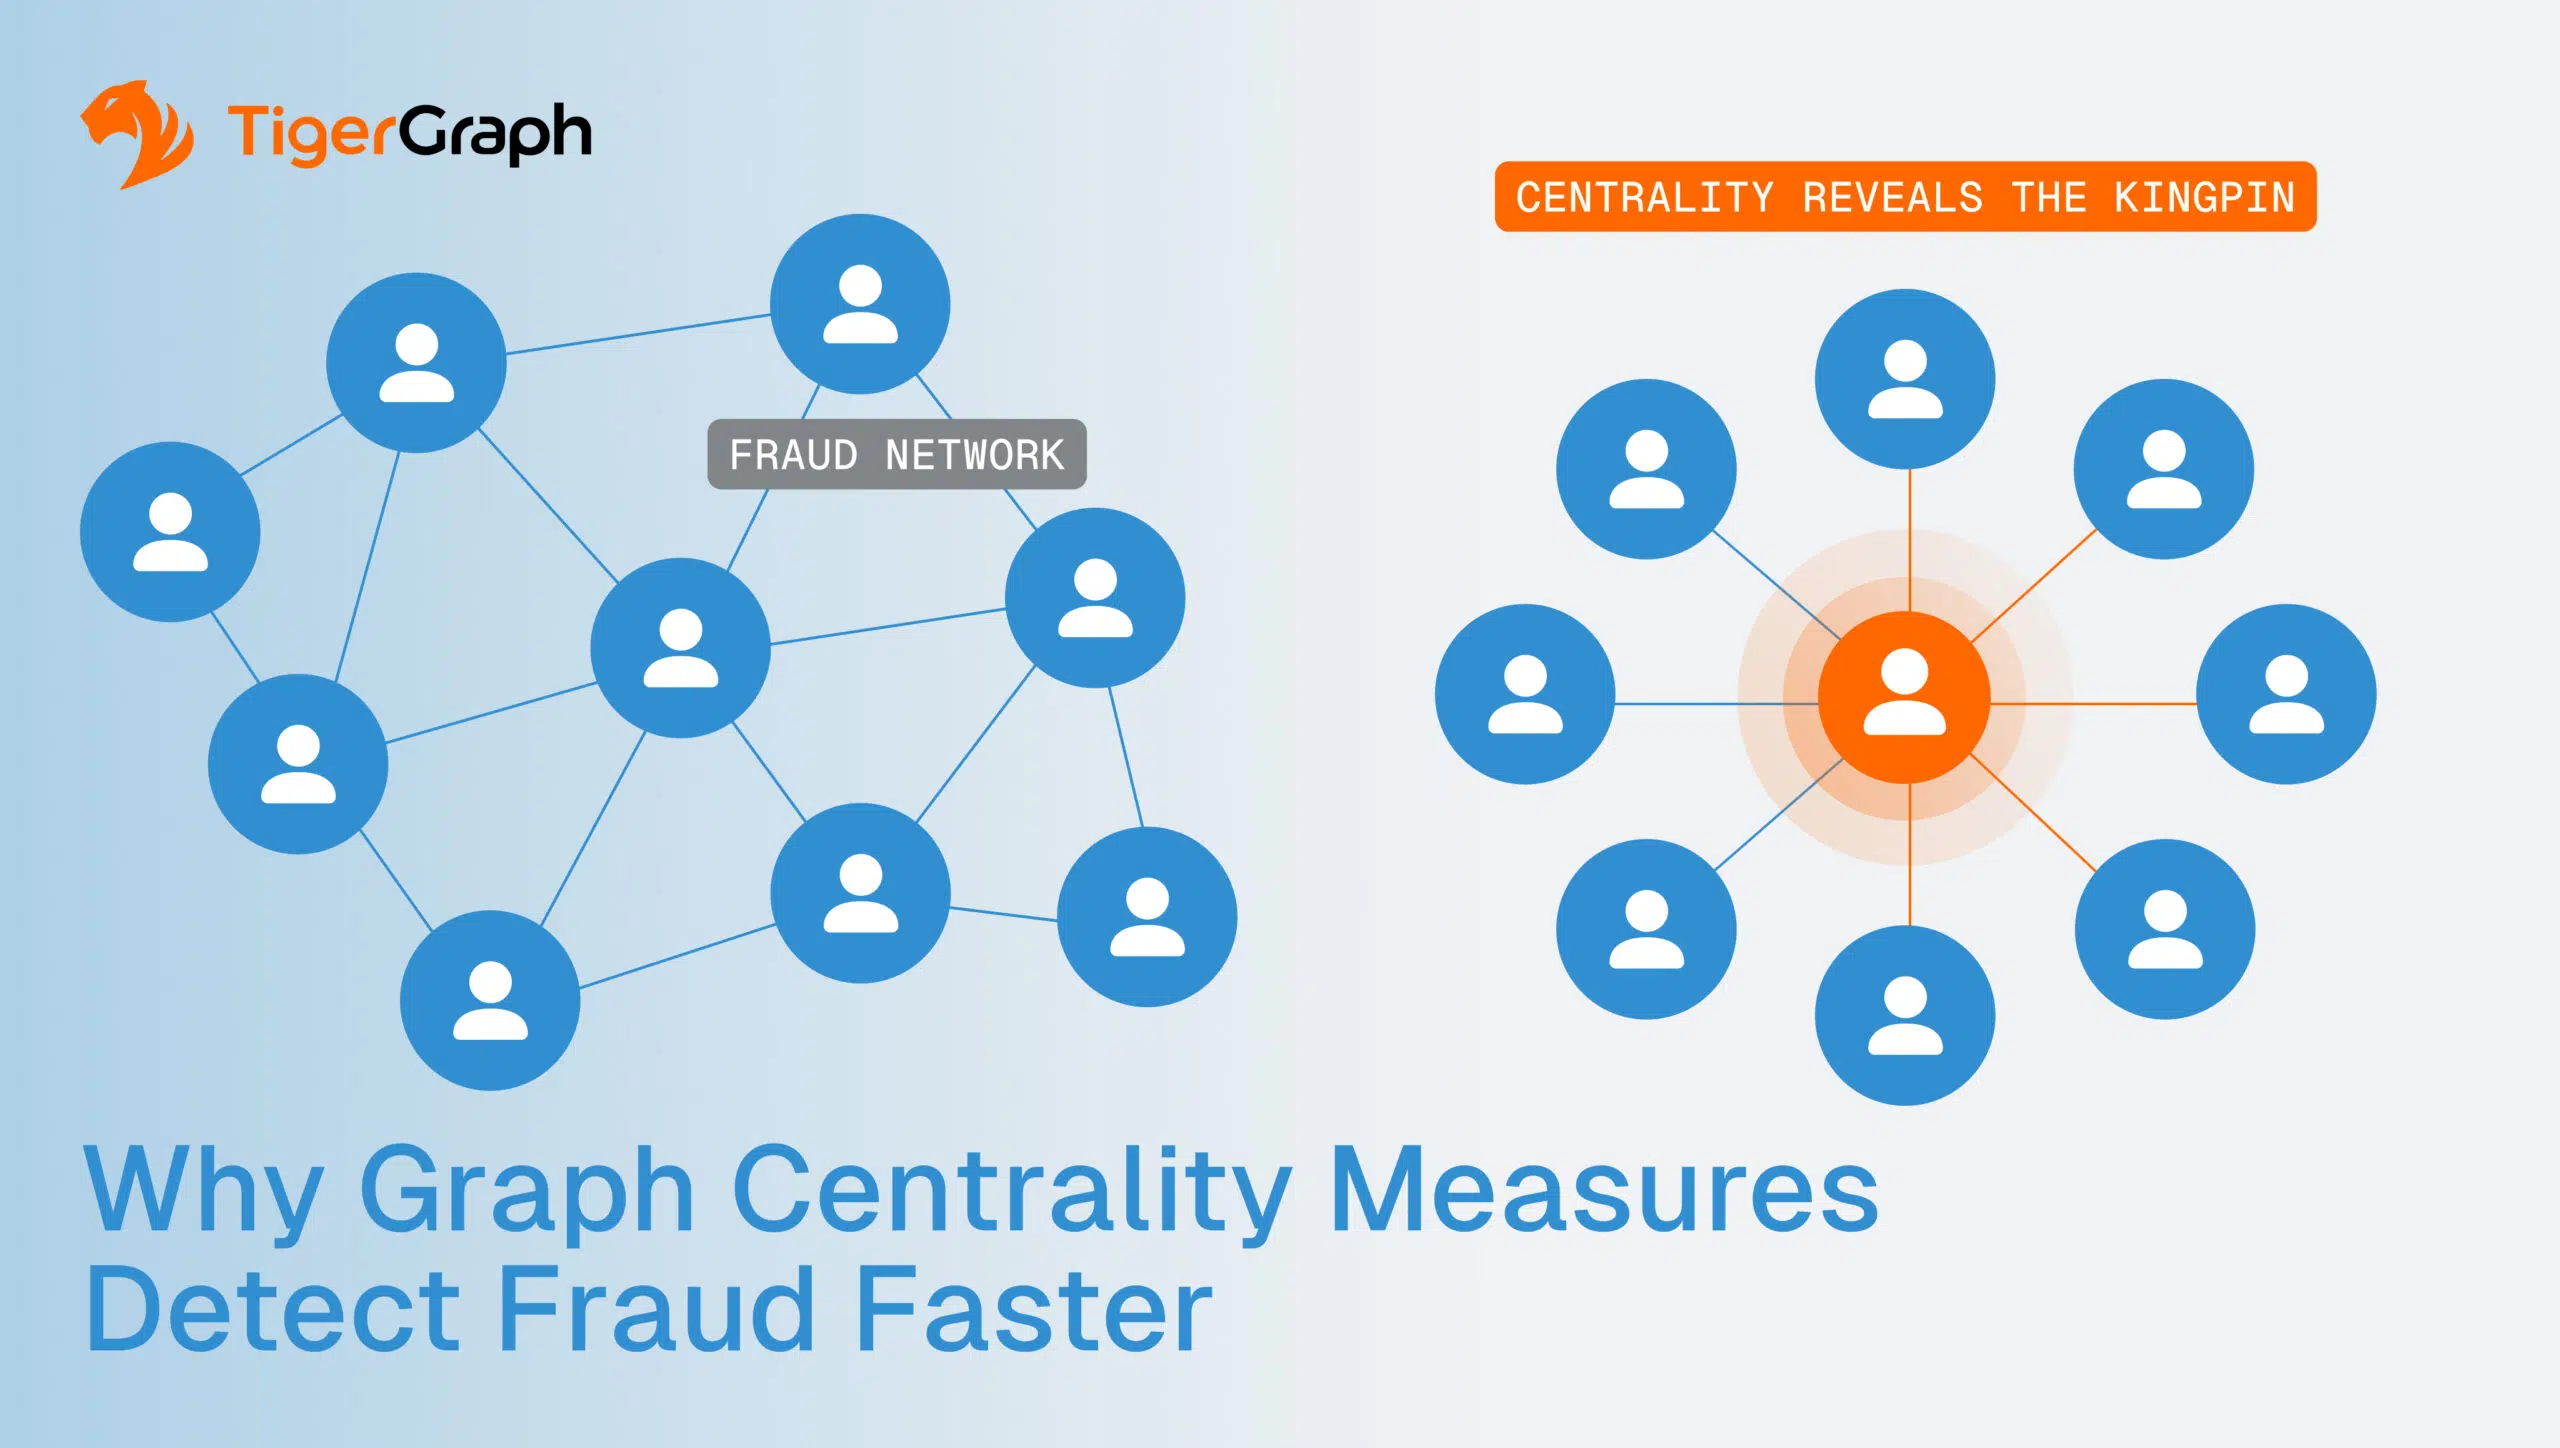
By analyzing the “importance” of a node in a network, centrality metrics like PageRank make it possible to uncover hidden facilitators, mule hubs, and high-impact risk nodes long before traditional methods catch on.
Why Centrality Matters in Fraud Detection
In every fraud network, some nodes are more dangerous than others:
A mule account may handle hundreds of micro-transactions.
On its own, each transaction looks small and harmless. But collectively, mule accounts move millions in illicit funds by splitting them into fragments. Centrality analysis highlights these accounts because they sit at the crossroads of dozens or hundreds of payment flows, quietly aggregating or dispersing stolen money. This is a perfect case for applying centrality measures for fraud prevention.
A merchant might quietly serve as the hub for a collusive fraud ring.
Fraudulent merchants often appear legitimate when viewed in isolation. But centrality metrics reveal when they are repeatedly connected to high-risk customers or devices, making them the anchor point of larger laundering operations that graph analytics for financial crime can expose reliably. Their position in the network exposes them as enablers rather than ordinary businesses.
A device or IP address may connect multiple synthetic identities.
Synthetic IDs are built to pass attribute checks, but they often recycle infrastructure like phones, laptops, or IP addresses. When a single device logs into dozens of accounts, or an IP address appears across multiple unrelated geographies, centrality flags these nodes as influential connectors that link otherwise “clean” identities into a fraud web. This type of fraud network analysis reveals when infrastructure is being reused by bad actors.
Centrality metrics make these relationships visible:
Degree Centrality: Surface unusually connected entities.
Accounts tied to dozens of cards, or devices linked across multiple unrelated customers, stand out as disproportionately connected nodes. These aren’t just “busy,” they’re structurally abnormal, often serving as coordination points in fraud networks.
Betweenness Centrality: Detect hidden bridges.
Fraud rings are often stitched together by intermediaries. A mule account, which moves funds between two otherwise separate networks, may not have the highest volume, but its position as a bridge makes it essential to sustaining the fraud. Betweenness centrality identifies these connectors, allowing investigators to disrupt entire networks by cutting one link.
PageRank Fraud Detection: Prioritize influential risk nodes.
Some accounts, merchants, or devices may not transact the most, but they connect to entities that are themselves risky. PageRank fraud detection weighs influence, revealing the “kingpins” of fraud networks. For example, an account tied to three merchants already linked to fraud will score higher than one with more but low-risk connections.
This helps fraud teams focus on the nodes most likely to spread or amplify fraud.
PageRank: From Search Engines to Fraud Rings
PageRank was originally designed to rank web pages based on influence, not just clicks. In fraud detection, the same principle applies. An account’s risk isn’t defined only by its transaction count, but by who it transacts with and how those entities behave.
For example:
- Two accounts each process 50 transactions.
- One connects to random, low-risk merchants.
- The other connects to merchants already linked to confirmed fraud.
A rules engine may flag them equally. PageRank will not. It weights the second account higher because of its connections to influential, in this case, risky, nodes.
This ability to prioritize risk by influence makes PageRank fraud detection invaluable in entity centrality banking programs when fraud teams are buried in alerts. Instead of chasing every anomaly, they can focus first on the nodes most likely to spread or amplify fraud.
That shift changes fraud detection from reactive monitoring to proactive defense. PageRank shows where anomalies occur, and it highlights who matters most in the network. It pinpoints the linchpins that, if disrupted, can dismantle entire fraud ecosystems.
Why this matters operationally:
- Reduced false positives. Fraud teams no longer waste cycles on edge cases with little downstream impact.
- Faster triage. High-priority alerts surface first, letting analysts move quickly on the threats most likely to spread.
- Regulatory confidence. PageRank provides an explainable context that shows that an account was flagged and how its connections to risky nodes justify intervention.
It gives fraud leaders what they need most: precision, speed, and a defensible framework for decisions in an environment where milliseconds and audit trails both matter.
Real-World Impact: Faster Triage, Better Precision
TigerGraph customers are already applying PageRank and related measures to transform detection:
- JP Morgan Chase improved precision, reduced false positives, and achieved more than $50 million in annual fraud savings, at enterprise scale, across 50M+ transactions per day and a 30TB+ dataset.
- Nubank, Latin America’s largest digital bank, integrated over 30 graph-derived features, including PageRank, shortest path, and community detection, into its fraud pipeline. This lifted fraud model recall significantly from a baseline of 28%, reduced false positives, and prevented millions in monthly scam losses without adding headcount.
Both banks demonstrate how combining graph centrality in fraud detection with advanced fraud network analysis delivers tangible ROI, with fewer false positives, stronger compliance, and faster resolution.
Centrality helps fraud teams focus on what matters most—the nodes with the highest impact on fraud networks.
Why TigerGraph Delivers
Centrality measures only matter if they can run at scale. That’s why graph-powered identity resolution and graph analytics for financial crime are core to TigerGraph’s value proposition.
Where other tools stall out on batch jobs, TigerGraph delivers real-time insights, surfacing hidden fraud facilitators while there’s still time to stop the loss.
Usability is also important. In TigerGraph, centrality measures are a native part of the compute environment. Graph algorithms like PageRank, Louvain, and shortest path run in the same setting with other graph queries and analytics, so there’s no need to transfer data. The algorithms can also be customized by users, if they want to say, make certain relationships more valuable than others.
Fraud isn’t random. It’s networked. And in every network, some nodes matter more than others. Centrality measures like PageRank expose hidden facilitators, helping banks detect fraud faster, triage alerts with precision, and satisfy regulators with explainable, defensible evidence.
Centrality gives fraud teams the ability to see beyond transactions and uncover the influence behind them.
The question is really, “Where do we start?” Many banks begin with PageRank for mule detection, then expand into betweenness for AML investigations or Louvain for fraud-ring discovery.
TigerGraph enables a quick transition from pilot to enterprise scale, thanks to proven algorithms, sub-millisecond performance, and proven customer results. Reach out to take your place among them.
