Skip to content
START FOR FREE
START FOR FREE
  • SUPPORT
  • COMMUNITY
Menu
  • SUPPORT
  • COMMUNITY
MENUMENU
  • Products
    • The World’s Fastest and Most Scalable Graph Platform

      LEARN MORE

      Watch a TigerGraph Demo

      TIGERGRAPH CLOUD

      • Overview
      • TigerGraph Cloud Suite
      • FAQ
      • Pricing

      USER TOOLS

      • GraphStudio
      • Insights
      • Application Workbenches
      • Connectors and Drivers
      • Starter Kits
      • openCypher Support

      TIGERGRAPH DB

      • Overview
      • GSQL Query Language
      • Compare Editions

      GRAPH DATA SCIENCE

      • Graph Data Science Library
      • Machine Learning Workbench
  • Solutions
    • The World’s Fastest and Most Scalable Graph Platform

      LEARN MORE

      Watch a TigerGraph Demo

      Solutions

      • Solutions Overview

      INCREASE REVENUE

      • Customer Journey/360
      • Product Marketing
      • Entity Resolution
      • Recommendation Engine

      MANAGE RISK

      • Fraud Detection
      • Anti-Money Laundering
      • Threat Detection
      • Risk Monitoring

      IMPROVE OPERATIONS

      • Supply Chain Analysis
      • Energy Management
      • Network Optimization

      By Industry

      • Advertising, Media & Entertainment
      • Financial Services
      • Healthcare & Life Sciences

      FOUNDATIONAL

      • AI & Machine Learning
      • Time Series Analysis
      • Geospatial Analysis
  • Customers
    • The World’s Fastest and Most Scalable Graph Platform

      LEARN MORE

      CUSTOMER SUCCESS STORIES

      • Ford
      • Intuit
      • JPMorgan Chase
      • READ MORE SUCCESS STORIES
      • Jaguar Land Rover
      • United Health Group
      • Xbox
  • Partners
    • The World’s Fastest and Most Scalable Graph Platform

      LEARN MORE

      PARTNER PROGRAM

      • Partner Benefits
      • TigerGraph Partners
      • Sign Up
      TigerGraph partners with organizations that offer complementary technology solutions and services.​
  • Resources
    • The World’s Fastest and Most Scalable Graph Platform

      LEARN MORE

      BLOG

      • TigerGraph Blog

      RESOURCES

      • Resource Library
      • Benchmarks
      • Demos
      • O'Reilly Graph + ML Book

      EVENTS & WEBINARS

      • Graph+AI Summit
      • Graph for All - Million Dollar Challenge
      • Events &Trade Shows
      • Webinars

      DEVELOPERS

      • Documentation
      • Ecosystem
      • Developers Hub
      • Community Forum

      SUPPORT

      • Contact Support
      • Production Guidelines

      EDUCATION

      • Training & Certifications
  • Company
    • Join the World’s Fastest and Most Scalable Graph Platform

      WE ARE HIRING

      COMPANY

      • Company Overview
      • Leadership
      • Legal Terms
      • Patents
      • Security and Compliance

      CAREERS

      • Join Us
      • Open Positions

      AWARDS

      • Awards and Recognition
      • Leader in Forrester Wave
      • Gartner Research

      PRESS RELEASE

      • Read All Press Releases
      TigerGraph Reports Exceptional Customer Growth and Product Leadership as More Market-Leading Companies Tap the Power of Graph
      March 1, 2023
      Read More »

      NEWS

      • Read All News
      The-New-Stack-Logo-square

      Multiple Vendors Make Data and Analytics Ubiquitous

      TigerGraph enhances fundamentals in latest platform update

  • START FREE
    • The World’s Fastest and Most Scalable Graph Platform

      GET STARTED

      • Request a Demo
      • CONTACT US
      • Try TigerGraph
      • START FREE
      • TRY AN ONLINE DEMO

Building the Next-Generation Agile Catalog for Retail eCommerce with Graph Database & Analytics

  • Kevin Cai
  • July 29, 2020
  • blog, eCommerce, Supply Chain
  • Blog >
  • Building the Next-Generation Agile Catalog for Retail eCommerce with Graph Database & Analytics

Introduction

Product catalog and inventory management is the foundation and is crucial to the success of any eCommerce or traditional retailer. Selling products through multiple sales channels could easily cause confusion in your business operations without a good management system in place. Keeping an accurate inventory of items in high demand  as the business grows is essential for maintaining and improving the customer satisfaction.  In times of sudden supply disruption and rapid demand changes due to events such as the COVID-19 Pandemic, retailers have a pressing need to improve the accuracy of their inventory and manage it closely with a rapidly changing item catalog.

Growing Your Business and Responding to Rapid Demand & Supply Changes with Graph

Many pieces of software are capable of managing simple catalogs, but plugging into a graph database opens a whole world of opportunities for your business allowing you to utilize your business data to its fullest potential allowing for a better overall customer experience.

A good catalog management system provides users with a smooth experience when searching for specific products, whether they have the exact name of a product, or only a few attributes or characteristics of a general product. With item catalog powered by TigerGraph, users can quickly narrow down a broad search over the entire catalog. The speed at which product results are returned is unparalleled, as the related products are pre-connected via common attributes or categories, unlike item catalogs built on relational databases, which require complex table joins or item catalogs powered by NoSQL databases, that need scanning the massive key-value pair table multiple times to find related or similar products.

Naturally, people want to see what they want, when they want, as fast as possible. With the power of graph analysis, recommendation systems can be built to potentially show customers what they want before even having to search for it themselves.

The Power of Graph

Putting your catalog data into TigerGraph will allow you to uncover product trends and other analyses unseen in your basic inventory and catalog management tools. These insights can range from finding duplicates in your data to enabling you to market your products based on customer behavior and product conversion rates.

Products don’t always come from one supplier, leading to discrepancies in their descriptions. A good catalog management system allows for standardization of products and descriptions from a variety of suppliers to predefined product categories. A great catalog management system allows for on-the-fly standardization and categorization of products to undefined or new categories such as “curbside pickup eligible”, “pandemic preparedness ”and “COVID-19 Pandemic essentials”.

Normalization of Incoming Data

Utilizing a very common, but powerful graph database use case – entity resolution, we are able to quickly normalize data entries within our catalog graph. For example, any given brand may have nicknames, abbreviations, or even just plain typos when being entered into the database. For example, CK is often used as shorthand for Calvin Klein. When it is entered into the graph, there will be a chance of multiple entities of the same brand. The figure below represents this particular discrepancy in the data. Brands and their respective products loaded into the graph will have the possibility of being “duplicates” of a different name.

Once all the data is loaded into the graph, we can run an entity resolution query on the graph to do a quick clean up. The resulting subgraph for the Calvin Klein graph will look like the following figure.

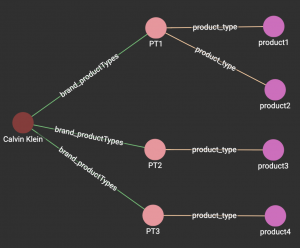
We have chosen to merge the duplicate entities that are determined using the entity resolution query. The products are now all linked to the “Calvin Klein” brand vertex through their respective ProductType vertices.

Analytics on the Fly

Predefined categories consist of such categories as “household”, or “party”. Undefined categories are specific to none, and are defined differently for each situation.

Recently, the impact of COVID-19 has shown us a perfect example of both predefined and  undefined categories. With social distancing rules in effect, more people are making use of the curbside pickup option from larger retailers. Different retailers apply their own criteria, allowing curbside pickup for a different predefined range of products. Products from all types of categories are grouped into a “pandemic preparedness” category to market to customers. This would likely include hand sanitizers, Clorox sanitizing wipes, and other types of products that are usually not grouped in the same category. An unlikely, but significantly affected product is toilet paper, which wouldn’t necessarily be part of a COVID-19 kit. With TigerGraph, we are able to create new product categories depending on the current situation of the world around us and add products to it based on the demand changes.

Product Impact Analysis Using TigerGraph

Let’s take a look at how we can use TigerGraph to classify products into undefined categories, and also which products are the most impacted by current product trends.

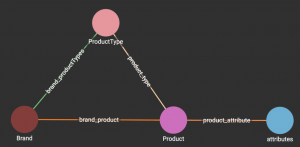
To set up the schema we’ll need 4 vertex types : Product, Brand, ProductType, and Attribute with edges between them. See the graph schema below. This is a simplified schema to illustrate the example.

The example assumes that data normalization is performed before loading the data into TigerGraph. Let’s review  the graph analytics of the loaded item data in TigerGraph. Our first query will determine which products are the most impacted by the current product trends. Using the numOfUnits attribute on each product vertex, we can effectively show which products, brands, or types of products that are highest in demand.

In one particular retail catalog use case, we were able to process 230GB of data in around 1 hour. By pre-processing the queries to insert edges (new relationships) and values, we were able to fully connect all of the related items in the graph or connected data within 6 minutes. Previously, that 230GB dataset was loaded into a  Hadoop-based NoSQL database and processed with the queries to identify and build the new relationships  – it took over 6 hours to identify new relationships, insert and update the values to connect the products with new relationships as opposed to just 6 minutes with TigerGraph.

From this fully connected graph, we were able to run product analysis queries in sub-second times. These queries included finding the top k products or product attributes based on other factors in the graph, the top k similar product types based on an input product, and a brand performance compared to the other brands in the graph. All these queries performed with sub-second response times.

Creating the Undefined Categories 

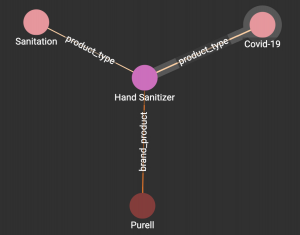
Now that we have our most impacted products, we can create a new productType vertex (category) and add products to this new product category by simply linking existing products to the new productType vertex. The figure below depicts a very simple example of an on-the-fly categorization of a product, creating the new Covid-19 ProducType vertex.

More Than Just a Catalog Management System

Every business needs a catalog management system, so why not get more out of one? We’ve shown that TigerGraph’s capabilities extend beyond simple management of a catalog to also create unique product categories to your own business and provide insights into current and situational trends in the marketplace.

Get Started with TigerGraph Cloud

Register for TigerGraph Cloud at https://www.tigergraph.com/cloud and use the free tier to explore the new starter kit on AWS or Azure Cloud.

You Might Also Like

Trillion edges benchmark: new world record beyond 100TB by TigerGraph featuring AMD based Amazon EC2 instances

Trillion edges benchmark: new world record...

March 13, 2023
Graph Databases 101: Your Top 5 Questions with Non-Technical Answers

Graph Databases 101: Your Top 5...

February 7, 2023
It’s Time to Harness the Power of Graph Technology [Infographic]

It’s Time to Harness the Power...

January 25, 2023

Introducing TigerGraph 3.0

July 1, 2020

Everything to Know to Pass your TigerGraph Certification Test

June 24, 2020

Neo4j 4.0 Fabric – A Look Behind the Curtain

February 7, 2020

TigerGraph Blog

  • Categories
    • blogs
      • About TigerGraph
      • Benchmark
      • Business
      • Community
      • Compliance
      • Customer
      • Customer 360
      • Cybersecurity
      • Developers
      • Digital Twin
      • eCommerce
      • Emerging Use Cases
      • Entity Resolution
      • Finance
      • Fraud / Anti-Money Laundering
      • GQL
      • Graph Database Market
      • Graph Databases
      • GSQL
      • Healthcare
      • Machine Learning / AI
      • Podcast
      • Supply Chain
      • TigerGraph
      • TigerGraph Cloud
    • Graph AI On Demand
      • Analysts and Research
      • Customer 360 and Entity Resolution
      • Customer Spotlight
      • Development
      • Finance, Banking, Insurance
      • Keynote
      • Session
    • Video
  • Recent Posts

    • Trillion edges benchmark: new world record beyond 100TB by TigerGraph featuring AMD based Amazon EC2 instances
    • Overview of Graph and Machine Learning with TigerGraph | Mar 8 @ 11am PST
    • Gartner Data & Analytics Summit 2023, London
    • Gartner Data and Analytics Summit, Orlando
    • Transaction Surveillance with Maximum Flow Algorithm
    TigerGraph

    Product

    SOLUTIONS

    customers

    RESOURCES

    start for free

    TIGERGRAPH DB
    • Overview
    • Features
    • GSQL Query Language
    GRAPH DATA SCIENCE
    • Graph Data Science Library
    • Machine Learning Workbench
    TIGERGRAPH CLOUD
    • Overview
    • Cloud Starter Kits
    • Login
    • FAQ
    • Pricing
    • Cloud Marketplaces
    USEr TOOLS
    • GraphStudio
    • TigerGraph Insights
    • Application Workbenches
    • Connectors and Drivers
    • Starter Kits
    • openCypher Support
    SOLUTIONS
    • Why Graph?
    industry
    • Advertising, Media & Entertainment
    • Financial Services
    • Healthcare & Life Sciences
    use cases
    • Benefits
    • Product & Service Marketing
    • Entity Resolution
    • Customer 360/MDM
    • Recommendation Engine
    • Anti-Money Laundering
    • Cybersecurity Threat Detection
    • Fraud Detection
    • Risk Assessment & Monitoring
    • Energy Management
    • Network & IT Management
    • Supply Chain Analysis
    • AI & Machine Learning
    • Geospatial Analysis
    • Time Series Analysis
    success stories
    • Customer Success Stories

    Partners

    Partner program
    • Partner Benefits
    • TigerGraph Partners
    • Sign Up
    LIBRARY
    • Resources
    • Benchmark
    • Webinars
    Events
    • Trade Shows
    • Graph + AI Summit
    • Million Dollar Challenge
    EDUCATION
    • Training & Certifications
    Blog
    • TigerGraph Blog
    DEVELOPERS
    • Developers Hub
    • Community Forum
    • Documentation
    • Ecosystem

    COMPANY

    Company
    • Overview
    • Careers
    • News
    • Press Release
    • Awards
    • Legal
    • Patents
    • Security and Compliance
    • Contact
    Get Started
    • Start Free
    • Compare Editions
    • Online Demo - Test Drive
    • Request a Demo

    Product

    • Overview
    • TigerGraph 3.0
    • TIGERGRAPH DB
    • TIGERGRAPH CLOUD
    • GRAPHSTUDIO
    • TRY NOW

    customers

    • success stories

    RESOURCES

    • LIBRARY
    • Events
    • EDUCATION
    • BLOG
    • DEVELOPERS

    SOLUTIONS

    • SOLUTIONS
    • use cases
    • industry

    Partners

    • partner program

    company

    • Overview
    • news
    • Press Release
    • Awards

    start for free

    • Request Demo
    • take a test drive
    • SUPPORT
    • COMMUNITY
    • CONTACT
    • Copyright © 2023 TigerGraph
    • Privacy Policy
    • Linkedin
    • Facebook
    • Twitter

    Copyright © 2020 TigerGraph | Privacy Policy

    Copyright © 2020 TigerGraph Privacy Policy

    • SUPPORT
    • COMMUNITY
    • COMPANY
    • CONTACT
    • Linkedin
    • Facebook
    • Twitter

    Copyright © 2020 TigerGraph

    Privacy Policy

    • Products
    • Solutions
    • Customers
    • Partners
    • Resources
    • Company
    • START FREE
    START FOR FREE
    START FOR FREE
    TigerGraph
    PRODUCT
    PRODUCT
    • Overview
    • GraphStudio UI
    • Graph Data Science Library
    TIGERGRAPH DB
    • Overview
    • Features
    • GSQL Query Language
    TIGERGRAPH CLOUD
    • Overview
    • Cloud Starter Kits
    TRY TIGERGRAPH
    • Get Started for Free
    • Compare Editions
    SOLUTIONS
    SOLUTIONS
    • Why Graph?
    use cases
    • Benefits
    • Product & Service Marketing
    • Entity Resolution
    • Customer Journey/360
    • Recommendation Engine
    • Anti-Money Laundering (AML)
    • Cybersecurity Threat Detection
    • Fraud Detection
    • Risk Assessment & Monitoring
    • Energy Management
    • Network Resources Optimization
    • Supply Chain Analysis
    • AI & Machine Learning
    • Geospatial Analysis
    • Time Series Analysis
    industry
    • Advertising, Media & Entertainment
    • Financial Services
    • Healthcare & Life Sciences
    CUSTOMERS
    read all success stories


    PARTNERS
    Partner program
    • Partner Benefits
    • TigerGraph Partners
    • Sign Up
    RESOURCES
    LIBRARY
    • Resource Library
    • Benchmark
    • Webinars
    Events
    • Trade Shows
    • Graph + AI Summit
    • Graph for All - Million Dollar Challenge
    EDUCATION
    • TigerGraph Academy
    • Certification
    Blog
    • TigerGraph Blog
    DEVELOPERS
    • Developers Hub
    • Community Forum
    • Documentation
    • Ecosystem
    COMPANY
    COMPANY
    • Overview
    • Leadership
    • Careers  
    NEWS
    PRESS RELEASE
    AWARDS
    START FREE
    Start Free
    • Request a Demo
    • SUPPORT
    • COMMUNITY
    • CONTACT
    Dr. Jay Yu

    Dr. Jay Yu | VP of Product and Innovation

    Dr. Jay Yu is the VP of Product and Innovation at TigerGraph, responsible for driving product strategy and roadmap, as well as fostering innovation in graph database engine and graph solutions. He is a proven hands-on full-stack innovator, strategic thinker, leader, and evangelist for new technology and product, with 25+ years of industry experience ranging from highly scalable distributed database engine company (Teradata), B2B e-commerce services startup, to consumer-facing financial applications company (Intuit). He received his PhD from the University of Wisconsin - Madison, where he specialized in large scale parallel database systems

    Todd Blaschka | COO

    Todd Blaschka is a veteran in the enterprise software industry. He is passionate about creating entirely new segments in data, analytics and AI, with the distinction of establishing graph analytics as a Gartner Top 10 Data & Analytics trend two years in a row. By fervently focusing on critical industry and customer challenges, the companies under Todd's leadership have delivered significant quantifiable results to the largest brands in the world through channel and solution sales approach. Prior to TigerGraph, Todd led go to market and customer experience functions at Clustrix (acquired by MariaDB), Dataguise and IBM.