Skip to content
START FOR FREE
START FOR FREE
  • SUPPORT
  • COMMUNITY
Menu
  • SUPPORT
  • COMMUNITY
MENUMENU
  • Products
    • The World’s Fastest and Most Scalable Graph Platform

      LEARN MORE

      Watch a TigerGraph Demo

      TIGERGRAPH CLOUD

      • Overview
      • TigerGraph Cloud Suite
      • FAQ
      • Pricing

      USER TOOLS

      • GraphStudio
      • Insights
      • Application Workbenches
      • Connectors and Drivers
      • Starter Kits
      • openCypher Support

      TIGERGRAPH DB

      • Overview
      • GSQL Query Language
      • Compare Editions

      GRAPH DATA SCIENCE

      • Graph Data Science Library
      • Machine Learning Workbench
  • Solutions
    • The World’s Fastest and Most Scalable Graph Platform

      LEARN MORE

      Watch a TigerGraph Demo

      Solutions

      • Solutions Overview

      INCREASE REVENUE

      • Customer Journey/360
      • Product Marketing
      • Entity Resolution
      • Recommendation Engine

      MANAGE RISK

      • Fraud Detection
      • Anti-Money Laundering
      • Threat Detection
      • Risk Monitoring

      IMPROVE OPERATIONS

      • Supply Chain Analysis
      • Energy Management
      • Network Optimization

      By Industry

      • Advertising, Media & Entertainment
      • Financial Services
      • Healthcare & Life Sciences

      FOUNDATIONAL

      • AI & Machine Learning
      • Time Series Analysis
      • Geospatial Analysis
  • Customers
    • The World’s Fastest and Most Scalable Graph Platform

      LEARN MORE

      CUSTOMER SUCCESS STORIES

      • Ford
      • Intuit
      • JPMorgan Chase
      • READ MORE SUCCESS STORIES
      • Jaguar Land Rover
      • United Health Group
      • Xbox
  • Partners
    • The World’s Fastest and Most Scalable Graph Platform

      LEARN MORE

      PARTNER PROGRAM

      • Partner Benefits
      • TigerGraph Partners
      • Sign Up
      TigerGraph partners with organizations that offer complementary technology solutions and services.​
  • Resources
    • The World’s Fastest and Most Scalable Graph Platform

      LEARN MORE

      BLOG

      • TigerGraph Blog

      RESOURCES

      • Resource Library
      • Benchmarks
      • Demos
      • O'Reilly Graph + ML Book

      EVENTS & WEBINARS

      • Graph+AI Summit
      • Graph for All - Million Dollar Challenge
      • Events &Trade Shows
      • Webinars

      DEVELOPERS

      • Documentation
      • Ecosystem
      • Developers Hub
      • Community Forum

      SUPPORT

      • Contact Support
      • Production Guidelines

      EDUCATION

      • Training & Certifications
  • Company
    • Join the World’s Fastest and Most Scalable Graph Platform

      WE ARE HIRING

      COMPANY

      • Company Overview
      • Leadership
      • Legal Terms
      • Patents
      • Security and Compliance

      CAREERS

      • Join Us
      • Open Positions

      AWARDS

      • Awards and Recognition
      • Leader in Forrester Wave
      • Gartner Research

      PRESS RELEASE

      • Read All Press Releases
      TigerGraph Reports Exceptional Customer Growth and Product Leadership as More Market-Leading Companies Tap the Power of Graph
      March 1, 2023
      Read More »

      NEWS

      • Read All News
      The-New-Stack-Logo-square

      Multiple Vendors Make Data and Analytics Ubiquitous

      TigerGraph enhances fundamentals in latest platform update

  • START FREE
    • The World’s Fastest and Most Scalable Graph Platform

      GET STARTED

      • Request a Demo
      • CONTACT US
      • Try TigerGraph
      • START FREE
      • TRY AN ONLINE DEMO

Graph as the Foundation for Data Analytics and AI

  • Emily McAuliffe
  • December 16, 2021
  • blog, Graph Databases
  • Blog >
  • Graph as the Foundation for Data Analytics and AI

This is an abbreviated version of a presentation by Rita Sallam during the Fall 2021 Graph + AI Fall Summit.

Rita Sallam

Rita Sallam, Distinguished VP and Fellow, Gartner

Watch the full session from Graph + AI Summit Fall

My goal for today is to challenge you to think differently about how you can innovate using data. Specifically, of course, by creating connections across what we know is increasingly complex data. As part of that, I’ll share with you why, at Gartner, we believe that graph technology does form the foundation of how you might achieve that with data analytics and AI. 

Data and analytics, and AI have never been more critical – it’s just harder to make sense of a world with ever-more interdependencies, connections, and unintended consequences. And we have to do that faster than ever before, but importantly, faster than our competitors. 

The global Covid-19 pandemic has forced most of you to respond in new ways to previously unimaginable demands to reimagine customer engagement, optimize resources, reinvent processes, rethink products and business models, and even, in some cases, your very purpose. And do that literally overnight. And what’s required to succeed in the face of this, just this unimaginable set of market shifts, is the ability to leverage increasing velocity and scale of analysis, to respond to this sort of never-ending change in the world. 

So, the question is, how will you respond? 

Three Scenarios

I’m going to begin by sharing three scenarios, and I’d like you to think about what these scenarios have in common.

Firstly, we know that supply chain demand planning has never been more important and unpredictable, right in the current environment. Imagine you’re a car manufacturer with many different models of cars, car parts, some of which are shared across models, and some of which are not. We know that car manufacturers face shifts in demand but also massive constraints on supplies such as computer chips and supply and shipping capacity. So what happens when demand for a product segment is suddenly surging in a particular geography. The manufacturer will no doubt need to know Will we have all the supply parts we need to meet this demand? What are the supplier risks or when demand drops drastically?

Now having surplus, how can we best use these spare parts? What impact does changing a feature of a car have on profitability? All critical questions that drive profitability and customer satisfaction. Okay, so that’s one.

Secondly, imagine that you are a city municipality, and you need to deliver food to elderly citizens who can’t leave their homes during the COVID crisis. How do you determine the best routes through the city that optimizes delivery speed and the use of transportation resources, while maintaining social distance between food couriers and other city residents along the road? Or along the routes? 

And case number three, which is actually my favorite, you’re trying to track the impact of climate change on penguins. And who doesn’t love penguins? To optimize innervate intervention strategies? How can you track distinct penguins, their movements, their shifts in migration, mating longevity patterns? And how does this all relate to weather temperature and other changes in their ecosystem?

What do all these things have in common? They are using graph technologies and AI to drive innovations.

Some Predictions

One of the things we do at Gartner is we make predictions about technology trends.

We believe graph technologies will be used in 80% of data and analytics innovations, facilitating rapid decision making across the enterprise. And that’s up from 10% in 2021. 

So why do we believe this is the case?

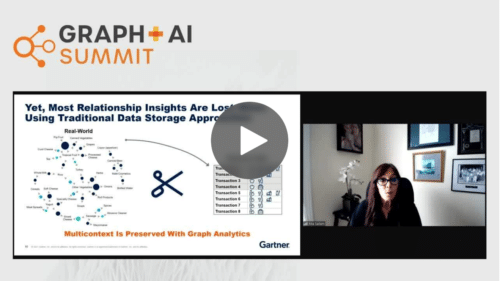
Well, first graphs enable agile data delivery by forming a platform that bridges data silos, captures metadata and data to extract abstract away from ETL processes. We know that knowledge graphs are a key component of that of data of a data fabric, exposing metadata, exposing business rules, enabling data scientists to quickly identify and use the data they need while preserving context, which is key.

Graphs are Relatable

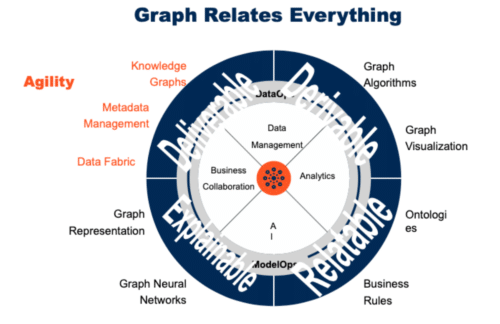
The next thing is that graphs are relatable. They enable business collaboration because they represent data conceptually using objects and relationships in the same way that we think about the world. And a knowledge graph schema, or ontology, provides a unified vocabulary or lingua franca across technical and business teams, and business rules can be encoded in a knowledge graph to provide contextual information and sentence semantics.

From an analytics and AI perspective, graphs enable you to use algorithms semantics to derive new insights and patterns from existing data. Graph algorithms allow users to explore complex data in an intuitive way to ask questions that were really difficult to ask before if they could ever ask them before. Graphs also increase the predictive power of existing data current AI machine

Graph visualization allows for free-form exploration of graphs in order to speed up the investing investigative process and reveal big picture insights. And lastly, running supervised and unsupervised learning models and graph databases can also reduce training time.

And last, but not least, graphs are explainable, and are beginning to be used to enable explainability of deep learning models. Explainable AI combines knowledge graphs with graph-based machine learning to provide visibility into black-box models. 

So graph plus data and analytics and AI and cloud are making innovative use cases possible at scale across most industries.

You Might Also Like

Trillion edges benchmark: new world record beyond 100TB by TigerGraph featuring AMD based Amazon EC2 instances

Trillion edges benchmark: new world record...

March 13, 2023
Graph Databases 101: Your Top 5 Questions with Non-Technical Answers

Graph Databases 101: Your Top 5...

February 7, 2023
It’s Time to Harness the Power of Graph Technology [Infographic]

It’s Time to Harness the Power...

January 25, 2023

Introducing TigerGraph 3.0

July 1, 2020

Everything to Know to Pass your TigerGraph Certification Test

June 24, 2020

Neo4j 4.0 Fabric – A Look Behind the Curtain

February 7, 2020

TigerGraph Blog

  • Categories
    • blogs
      • About TigerGraph
      • Benchmark
      • Business
      • Community
      • Compliance
      • Customer
      • Customer 360
      • Cybersecurity
      • Developers
      • Digital Twin
      • eCommerce
      • Emerging Use Cases
      • Entity Resolution
      • Finance
      • Fraud / Anti-Money Laundering
      • GQL
      • Graph Database Market
      • Graph Databases
      • GSQL
      • Healthcare
      • Machine Learning / AI
      • Podcast
      • Supply Chain
      • TigerGraph
      • TigerGraph Cloud
    • Graph AI On Demand
      • Analysts and Research
      • Customer 360 and Entity Resolution
      • Customer Spotlight
      • Development
      • Finance, Banking, Insurance
      • Keynote
      • Session
    • Video
  • Recent Posts

    • Trillion edges benchmark: new world record beyond 100TB by TigerGraph featuring AMD based Amazon EC2 instances
    • Overview of Graph and Machine Learning with TigerGraph | Mar 8 @ 11am PST
    • Gartner Data & Analytics Summit 2023, London
    • Gartner Data and Analytics Summit, Orlando
    • Transaction Surveillance with Maximum Flow Algorithm
    TigerGraph

    Product

    SOLUTIONS

    customers

    RESOURCES

    start for free

    TIGERGRAPH DB
    • Overview
    • Features
    • GSQL Query Language
    GRAPH DATA SCIENCE
    • Graph Data Science Library
    • Machine Learning Workbench
    TIGERGRAPH CLOUD
    • Overview
    • Cloud Starter Kits
    • Login
    • FAQ
    • Pricing
    • Cloud Marketplaces
    USEr TOOLS
    • GraphStudio
    • TigerGraph Insights
    • Application Workbenches
    • Connectors and Drivers
    • Starter Kits
    • openCypher Support
    SOLUTIONS
    • Why Graph?
    industry
    • Advertising, Media & Entertainment
    • Financial Services
    • Healthcare & Life Sciences
    use cases
    • Benefits
    • Product & Service Marketing
    • Entity Resolution
    • Customer 360/MDM
    • Recommendation Engine
    • Anti-Money Laundering
    • Cybersecurity Threat Detection
    • Fraud Detection
    • Risk Assessment & Monitoring
    • Energy Management
    • Network & IT Management
    • Supply Chain Analysis
    • AI & Machine Learning
    • Geospatial Analysis
    • Time Series Analysis
    success stories
    • Customer Success Stories

    Partners

    Partner program
    • Partner Benefits
    • TigerGraph Partners
    • Sign Up
    LIBRARY
    • Resources
    • Benchmark
    • Webinars
    Events
    • Trade Shows
    • Graph + AI Summit
    • Million Dollar Challenge
    EDUCATION
    • Training & Certifications
    Blog
    • TigerGraph Blog
    DEVELOPERS
    • Developers Hub
    • Community Forum
    • Documentation
    • Ecosystem

    COMPANY

    Company
    • Overview
    • Careers
    • News
    • Press Release
    • Awards
    • Legal
    • Patents
    • Security and Compliance
    • Contact
    Get Started
    • Start Free
    • Compare Editions
    • Online Demo - Test Drive
    • Request a Demo

    Product

    • Overview
    • TigerGraph 3.0
    • TIGERGRAPH DB
    • TIGERGRAPH CLOUD
    • GRAPHSTUDIO
    • TRY NOW

    customers

    • success stories

    RESOURCES

    • LIBRARY
    • Events
    • EDUCATION
    • BLOG
    • DEVELOPERS

    SOLUTIONS

    • SOLUTIONS
    • use cases
    • industry

    Partners

    • partner program

    company

    • Overview
    • news
    • Press Release
    • Awards

    start for free

    • Request Demo
    • take a test drive
    • SUPPORT
    • COMMUNITY
    • CONTACT
    • Copyright © 2023 TigerGraph
    • Privacy Policy
    • Linkedin
    • Facebook
    • Twitter

    Copyright © 2020 TigerGraph | Privacy Policy

    Copyright © 2020 TigerGraph Privacy Policy

    • SUPPORT
    • COMMUNITY
    • COMPANY
    • CONTACT
    • Linkedin
    • Facebook
    • Twitter

    Copyright © 2020 TigerGraph

    Privacy Policy

    • Products
    • Solutions
    • Customers
    • Partners
    • Resources
    • Company
    • START FREE
    START FOR FREE
    START FOR FREE
    TigerGraph
    PRODUCT
    PRODUCT
    • Overview
    • GraphStudio UI
    • Graph Data Science Library
    TIGERGRAPH DB
    • Overview
    • Features
    • GSQL Query Language
    TIGERGRAPH CLOUD
    • Overview
    • Cloud Starter Kits
    TRY TIGERGRAPH
    • Get Started for Free
    • Compare Editions
    SOLUTIONS
    SOLUTIONS
    • Why Graph?
    use cases
    • Benefits
    • Product & Service Marketing
    • Entity Resolution
    • Customer Journey/360
    • Recommendation Engine
    • Anti-Money Laundering (AML)
    • Cybersecurity Threat Detection
    • Fraud Detection
    • Risk Assessment & Monitoring
    • Energy Management
    • Network Resources Optimization
    • Supply Chain Analysis
    • AI & Machine Learning
    • Geospatial Analysis
    • Time Series Analysis
    industry
    • Advertising, Media & Entertainment
    • Financial Services
    • Healthcare & Life Sciences
    CUSTOMERS
    read all success stories


    PARTNERS
    Partner program
    • Partner Benefits
    • TigerGraph Partners
    • Sign Up
    RESOURCES
    LIBRARY
    • Resource Library
    • Benchmark
    • Webinars
    Events
    • Trade Shows
    • Graph + AI Summit
    • Graph for All - Million Dollar Challenge
    EDUCATION
    • TigerGraph Academy
    • Certification
    Blog
    • TigerGraph Blog
    DEVELOPERS
    • Developers Hub
    • Community Forum
    • Documentation
    • Ecosystem
    COMPANY
    COMPANY
    • Overview
    • Leadership
    • Careers  
    NEWS
    PRESS RELEASE
    AWARDS
    START FREE
    Start Free
    • Request a Demo
    • SUPPORT
    • COMMUNITY
    • CONTACT
    Dr. Jay Yu

    Dr. Jay Yu | VP of Product and Innovation

    Dr. Jay Yu is the VP of Product and Innovation at TigerGraph, responsible for driving product strategy and roadmap, as well as fostering innovation in graph database engine and graph solutions. He is a proven hands-on full-stack innovator, strategic thinker, leader, and evangelist for new technology and product, with 25+ years of industry experience ranging from highly scalable distributed database engine company (Teradata), B2B e-commerce services startup, to consumer-facing financial applications company (Intuit). He received his PhD from the University of Wisconsin - Madison, where he specialized in large scale parallel database systems

    Todd Blaschka | COO

    Todd Blaschka is a veteran in the enterprise software industry. He is passionate about creating entirely new segments in data, analytics and AI, with the distinction of establishing graph analytics as a Gartner Top 10 Data & Analytics trend two years in a row. By fervently focusing on critical industry and customer challenges, the companies under Todd's leadership have delivered significant quantifiable results to the largest brands in the world through channel and solution sales approach. Prior to TigerGraph, Todd led go to market and customer experience functions at Clustrix (acquired by MariaDB), Dataguise and IBM.