Skip to content
START FOR FREE
START FOR FREE
  • SUPPORT
  • COMMUNITY
Menu
  • SUPPORT
  • COMMUNITY
MENUMENU
  • Products
    • The World’s Fastest and Most Scalable Graph Platform

      LEARN MORE

      Watch a TigerGraph Demo

      TIGERGRAPH CLOUD

      • Overview
      • TigerGraph Cloud Suite
      • FAQ
      • Pricing

      USER TOOLS

      • GraphStudio
      • Insights
      • Application Workbenches
      • Connectors and Drivers
      • Starter Kits
      • openCypher Support

      TIGERGRAPH DB

      • Overview
      • GSQL Query Language
      • Compare Editions

      GRAPH DATA SCIENCE

      • Graph Data Science Library
      • Machine Learning Workbench
  • Solutions
    • The World’s Fastest and Most Scalable Graph Platform

      LEARN MORE

      Watch a TigerGraph Demo

      Solutions

      • Solutions Overview

      INCREASE REVENUE

      • Customer Journey/360
      • Product Marketing
      • Entity Resolution
      • Recommendation Engine

      MANAGE RISK

      • Fraud Detection
      • Anti-Money Laundering
      • Threat Detection
      • Risk Monitoring

      IMPROVE OPERATIONS

      • Supply Chain Analysis
      • Energy Management
      • Network Optimization

      By Industry

      • Advertising, Media & Entertainment
      • Financial Services
      • Healthcare & Life Sciences

      FOUNDATIONAL

      • AI & Machine Learning
      • Time Series Analysis
      • Geospatial Analysis
  • Customers
    • The World’s Fastest and Most Scalable Graph Platform

      LEARN MORE

      CUSTOMER SUCCESS STORIES

      • Ford
      • Intuit
      • JPMorgan Chase
      • READ MORE SUCCESS STORIES
      • Jaguar Land Rover
      • United Health Group
      • Xbox
  • Partners
    • The World’s Fastest and Most Scalable Graph Platform

      LEARN MORE

      PARTNER PROGRAM

      • Partner Benefits
      • TigerGraph Partners
      • Sign Up
      TigerGraph partners with organizations that offer complementary technology solutions and services.​
  • Resources
    • The World’s Fastest and Most Scalable Graph Platform

      LEARN MORE

      BLOG

      • TigerGraph Blog

      RESOURCES

      • Resource Library
      • Benchmarks
      • Demos
      • O'Reilly Graph + ML Book

      EVENTS & WEBINARS

      • Graph+AI Summit
      • Graph for All - Million Dollar Challenge
      • Events &Trade Shows
      • Webinars

      DEVELOPERS

      • Documentation
      • Ecosystem
      • Developers Hub
      • Community Forum

      SUPPORT

      • Contact Support
      • Production Guidelines

      EDUCATION

      • Training & Certifications
  • Company
    • Join the World’s Fastest and Most Scalable Graph Platform

      WE ARE HIRING

      COMPANY

      • Company Overview
      • Leadership
      • Legal Terms
      • Patents
      • Security and Compliance

      CAREERS

      • Join Us
      • Open Positions

      AWARDS

      • Awards and Recognition
      • Leader in Forrester Wave
      • Gartner Research

      PRESS RELEASE

      • Read All Press Releases
      TigerGraph Reports Exceptional Customer Growth and Product Leadership as More Market-Leading Companies Tap the Power of Graph
      March 1, 2023
      Read More »

      NEWS

      • Read All News
      The-New-Stack-Logo-square

      Multiple Vendors Make Data and Analytics Ubiquitous

      TigerGraph enhances fundamentals in latest platform update

  • START FREE
    • The World’s Fastest and Most Scalable Graph Platform

      GET STARTED

      • Request a Demo
      • CONTACT US
      • Try TigerGraph
      • START FREE
      • TRY AN ONLINE DEMO

Graph Databases 101: Your Top 5 Questions with Non-Technical Answers

  • Julia Astashkina
  • February 7, 2023
  • blog
  • Blog >
  • Graph Databases 101: Your Top 5 Questions with Non-Technical Answers

The world has always been built around connections, but the world today is more hyper-connected than ever before.

Tapping into the power of these rich, growing networks – whether that be financial transactions, social media networks, recommendation engines or global supply chains – will make or break the bottom-line of tomorrow’s leading enterprises.

Given this critical importance of connections in the modern business environment, it’s about time that our database technology kept up.

Legacy databases (known as relational databases or RDBMS) were built for well-mapped, stable and predictable processes like finance and accounting. These databases use rigid rows, columns and tables that don’t require frequent modifications, but when the database model does need to change, it’s an expensive hassle. 

But today’s business world is in regular flux – change is the only constant. When building software applications, business and user requirements change all the time. And yet, most legacy database software fights against these changes rather than evolving with them.

Enter graph databases. The graph database model is built to store and retrieve connections from the ground up. It’s more flexible, scalable and agile than RDBMS, and it’s the optimal data model for applications that harness artificial intelligence and machine learning. AI and ML thrive on connected data, and that’s exactly what graph technology delivers.

So, what’s a graph database and what’s it good for? I’m so glad you asked.

What Is a Graph Database?

A graph database stores two kinds of data: entities and the relationships between them. 

Data entities are stored as vertices (or sometimes nodes) and data relationships are stored as edges. Vertices represent nouns: people, places, products, locations, payments, and more. Edges represent the verbs or relationships that connect various vertices. This network of interconnected vertices and edges is called a graph. 

For example, a customer (vertex) has (edge) an shopping cart (vertex). The edge has connects the customer vertex and the shopping cart vertex.

Here’s another example: An app user (vertex) sends (edge) a payment (vertex) directed to (edge) another app user (vertex). The two app user vertices are connected to the payment vertex via the sends edge and the directed to edge, respectively.

In addition, vertices can have attributes which add more details to each record within a vertex. For instance, a customer vertex might have attributes like name, phone number and credit card number.

Graphs are often best understood visually. The images below are all graphs of vertices and edges that are stored in a graph database.
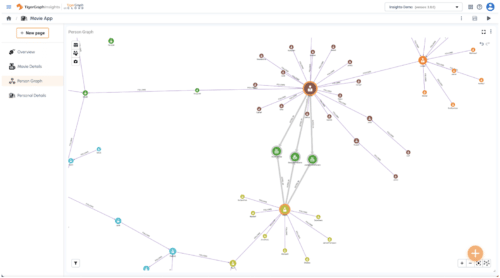
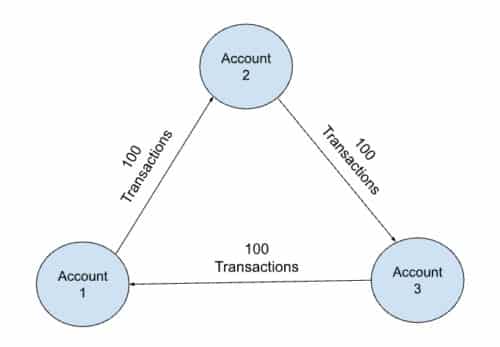
Graph database software stores all the records of these interconnected vertices, attributes, and edges so that they can be harnessed by various software applications. In other words, graph databases store networks of interrelated data.

What Is a Native Graph Database?

As graph technology grows in popularity, more and more database vendors offer “graph” capabilities alongside their existing data models (such as relational, document, wide column, key-value or other NoSQL stores). But the trouble with these graph add-on offerings is that they’re not optimized to store and query the connections between data entities.

If your application frequently needs to store and query data relationships, then you need a native graph database. 

The key difference between native and non-native graph technology is what it’s created for. A native graph database – like TigerGraph – uses something called index-free adjacency to physically point between connected vertices in the database. This ensures connected data queries are highly performant.

Essentially, if a database model is specifically engineered to store and query connected data then it’s a native graph database. If the database was first engineered for a different data model and only added “graph” capabilities later, then it’s a non-native graph database. 

Non-native graph data storage is often slower because all of the relationships in the graph have to be translated into a different data model (and then back again) for every graph query. 

While these differences might not appear critically important, it all comes down to why you’re using a graph database in the first place.

Why Use a Graph Database?

If your application frequently queries and harnesses the relationships between users, products, locations, or any other entities, then you’re better off using a best-in-class native graph database. The same is true if your use case leverages network effects or requires multiple-hop queries across your data.

A graph database is quicker for your development team to modify and quicker for your application to query. Graph database technology also grows and evolves alongside your business and application requirements – it never lags behind or gets stuck in the past. 

And it almost goes without saying that if your enterprise relies on graph analytics or graph data science, then you need a native graph database to ensure real-time performance for mission-critical applications. 

What Are Graph Databases Used for?

The real question is what are graph databases not used for? The use cases for graph technology are vast, diverse and growing. Here’s a rundown of some of the most popular graph database use cases out there today:

Most Popular Graph Database Use Cases:

  • Artificial Intelligence & Machine Learning 
  • Fraud Detection 
  • Recommendation Engines

Increase Revenue:

  • Customer 360 / Master Data Management
  • Entity Resolution
  • Product & Service Marketing

Reduce Costs & Manage Risks:

  • Anti-Money Laundering
  • Risk Assessment & Monitoring
  • Cybersecurity Threat Detection

Improve Operational Efficiency:

  • Supply Chain Analysis & Management
  • Energy Management System & Analytics
  • Network Resources Optimization

Foundational Technology:

  • Graph Data Science
  • Time-Series Analysis
  • Geospatial Analysis

…and a lot more! Graph technology is a tool to build the future, so there’s no limit to the use cases you might discover.

Who’s Already Using Graph Databases?

Graph databases have been skyrocketing in popularity for more than a decade, and everyone from enterprises organizations to innovative startups is tapping into the power of graph technology.

Here are just some of the leading companies who are already using graph database technology to deliver value to end-users and dominate their industries:

  • Intuit: AI-powered knowledge graph
  • JPMorgan Chase: fraud detection
  • Microsoft Xbox: customer experience
  • Ford: entity resolution
  • Amgen: social network analysis for healthcare
  • UnitedHealth Group: patient journey mapping

Of course, these are only a few of the many cutting-edge organizations using graph databases to harness connected data. Discover more graph database users and use cases on the TigerGraph Customers page.

Conclusion

Our world is shaped – and powered – by connections, so it’s time your database software catches up to reality. In fact, graph databases mimic the pattern-matching functions of how the human brain maps the world through neurons (vertices) and synapses (edges). It’s this human-intuitive data model that makes graph technology so unique and powerful.

No matter what your enterprise’s core business, it can be enhanced with the power of connected data. And if your team can tap into the power of data relationships today, you’ll be well ahead of the competition come tomorrow. 

You Might Also Like

Trillion edges benchmark: new world record beyond 100TB by TigerGraph featuring AMD based Amazon EC2 instances

Trillion edges benchmark: new world record...

March 13, 2023
It’s Time to Harness the Power of Graph Technology [Infographic]

It’s Time to Harness the Power...

January 25, 2023
TigerGraph Showcases Unrivaled Performance at Scale

TigerGraph Showcases Unrivaled Performance at Scale

January 12, 2023

Introducing TigerGraph 3.0

July 1, 2020

Everything to Know to Pass your TigerGraph Certification Test

June 24, 2020

Neo4j 4.0 Fabric – A Look Behind the Curtain

February 7, 2020

TigerGraph Blog

  • Categories
    • blogs
      • About TigerGraph
      • Benchmark
      • Business
      • Community
      • Compliance
      • Customer
      • Customer 360
      • Cybersecurity
      • Developers
      • Digital Twin
      • eCommerce
      • Emerging Use Cases
      • Entity Resolution
      • Finance
      • Fraud / Anti-Money Laundering
      • GQL
      • Graph Database Market
      • Graph Databases
      • GSQL
      • Healthcare
      • Machine Learning / AI
      • Podcast
      • Supply Chain
      • TigerGraph
      • TigerGraph Cloud
    • Graph AI On Demand
      • Analysts and Research
      • Customer 360 and Entity Resolution
      • Customer Spotlight
      • Development
      • Finance, Banking, Insurance
      • Keynote
      • Session
    • Video
  • Recent Posts

    • Trillion edges benchmark: new world record beyond 100TB by TigerGraph featuring AMD based Amazon EC2 instances
    • Overview of Graph and Machine Learning with TigerGraph | Mar 8 @ 11am PST
    • Gartner Data & Analytics Summit 2023, London
    • Gartner Data and Analytics Summit, Orlando
    • Transaction Surveillance with Maximum Flow Algorithm
    TigerGraph

    Product

    SOLUTIONS

    customers

    RESOURCES

    start for free

    TIGERGRAPH DB
    • Overview
    • Features
    • GSQL Query Language
    GRAPH DATA SCIENCE
    • Graph Data Science Library
    • Machine Learning Workbench
    TIGERGRAPH CLOUD
    • Overview
    • Cloud Starter Kits
    • Login
    • FAQ
    • Pricing
    • Cloud Marketplaces
    USEr TOOLS
    • GraphStudio
    • TigerGraph Insights
    • Application Workbenches
    • Connectors and Drivers
    • Starter Kits
    • openCypher Support
    SOLUTIONS
    • Why Graph?
    industry
    • Advertising, Media & Entertainment
    • Financial Services
    • Healthcare & Life Sciences
    use cases
    • Benefits
    • Product & Service Marketing
    • Entity Resolution
    • Customer 360/MDM
    • Recommendation Engine
    • Anti-Money Laundering
    • Cybersecurity Threat Detection
    • Fraud Detection
    • Risk Assessment & Monitoring
    • Energy Management
    • Network & IT Management
    • Supply Chain Analysis
    • AI & Machine Learning
    • Geospatial Analysis
    • Time Series Analysis
    success stories
    • Customer Success Stories

    Partners

    Partner program
    • Partner Benefits
    • TigerGraph Partners
    • Sign Up
    LIBRARY
    • Resources
    • Benchmark
    • Webinars
    Events
    • Trade Shows
    • Graph + AI Summit
    • Million Dollar Challenge
    EDUCATION
    • Training & Certifications
    Blog
    • TigerGraph Blog
    DEVELOPERS
    • Developers Hub
    • Community Forum
    • Documentation
    • Ecosystem

    COMPANY

    Company
    • Overview
    • Careers
    • News
    • Press Release
    • Awards
    • Legal
    • Patents
    • Security and Compliance
    • Contact
    Get Started
    • Start Free
    • Compare Editions
    • Online Demo - Test Drive
    • Request a Demo

    Product

    • Overview
    • TigerGraph 3.0
    • TIGERGRAPH DB
    • TIGERGRAPH CLOUD
    • GRAPHSTUDIO
    • TRY NOW

    customers

    • success stories

    RESOURCES

    • LIBRARY
    • Events
    • EDUCATION
    • BLOG
    • DEVELOPERS

    SOLUTIONS

    • SOLUTIONS
    • use cases
    • industry

    Partners

    • partner program

    company

    • Overview
    • news
    • Press Release
    • Awards

    start for free

    • Request Demo
    • take a test drive
    • SUPPORT
    • COMMUNITY
    • CONTACT
    • Copyright © 2023 TigerGraph
    • Privacy Policy
    • Linkedin
    • Facebook
    • Twitter

    Copyright © 2020 TigerGraph | Privacy Policy

    Copyright © 2020 TigerGraph Privacy Policy

    • SUPPORT
    • COMMUNITY
    • COMPANY
    • CONTACT
    • Linkedin
    • Facebook
    • Twitter

    Copyright © 2020 TigerGraph

    Privacy Policy

    • Products
    • Solutions
    • Customers
    • Partners
    • Resources
    • Company
    • START FREE
    START FOR FREE
    START FOR FREE
    TigerGraph
    PRODUCT
    PRODUCT
    • Overview
    • GraphStudio UI
    • Graph Data Science Library
    TIGERGRAPH DB
    • Overview
    • Features
    • GSQL Query Language
    TIGERGRAPH CLOUD
    • Overview
    • Cloud Starter Kits
    TRY TIGERGRAPH
    • Get Started for Free
    • Compare Editions
    SOLUTIONS
    SOLUTIONS
    • Why Graph?
    use cases
    • Benefits
    • Product & Service Marketing
    • Entity Resolution
    • Customer Journey/360
    • Recommendation Engine
    • Anti-Money Laundering (AML)
    • Cybersecurity Threat Detection
    • Fraud Detection
    • Risk Assessment & Monitoring
    • Energy Management
    • Network Resources Optimization
    • Supply Chain Analysis
    • AI & Machine Learning
    • Geospatial Analysis
    • Time Series Analysis
    industry
    • Advertising, Media & Entertainment
    • Financial Services
    • Healthcare & Life Sciences
    CUSTOMERS
    read all success stories


    PARTNERS
    Partner program
    • Partner Benefits
    • TigerGraph Partners
    • Sign Up
    RESOURCES
    LIBRARY
    • Resource Library
    • Benchmark
    • Webinars
    Events
    • Trade Shows
    • Graph + AI Summit
    • Graph for All - Million Dollar Challenge
    EDUCATION
    • TigerGraph Academy
    • Certification
    Blog
    • TigerGraph Blog
    DEVELOPERS
    • Developers Hub
    • Community Forum
    • Documentation
    • Ecosystem
    COMPANY
    COMPANY
    • Overview
    • Leadership
    • Careers  
    NEWS
    PRESS RELEASE
    AWARDS
    START FREE
    Start Free
    • Request a Demo
    • SUPPORT
    • COMMUNITY
    • CONTACT
    Dr. Jay Yu

    Dr. Jay Yu | VP of Product and Innovation

    Dr. Jay Yu is the VP of Product and Innovation at TigerGraph, responsible for driving product strategy and roadmap, as well as fostering innovation in graph database engine and graph solutions. He is a proven hands-on full-stack innovator, strategic thinker, leader, and evangelist for new technology and product, with 25+ years of industry experience ranging from highly scalable distributed database engine company (Teradata), B2B e-commerce services startup, to consumer-facing financial applications company (Intuit). He received his PhD from the University of Wisconsin - Madison, where he specialized in large scale parallel database systems

    Todd Blaschka | COO

    Todd Blaschka is a veteran in the enterprise software industry. He is passionate about creating entirely new segments in data, analytics and AI, with the distinction of establishing graph analytics as a Gartner Top 10 Data & Analytics trend two years in a row. By fervently focusing on critical industry and customer challenges, the companies under Todd's leadership have delivered significant quantifiable results to the largest brands in the world through channel and solution sales approach. Prior to TigerGraph, Todd led go to market and customer experience functions at Clustrix (acquired by MariaDB), Dataguise and IBM.