Skip to content
START FOR FREE
START FOR FREE
  • SUPPORT
  • COMMUNITY
Menu
  • SUPPORT
  • COMMUNITY
MENUMENU
  • Products
    • The World’s Fastest and Most Scalable Graph Platform

      LEARN MORE

      Watch a TigerGraph Demo

      TIGERGRAPH CLOUD

      • Overview
      • TigerGraph Cloud Suite
      • FAQ
      • Pricing

      USER TOOLS

      • GraphStudio
      • Insights
      • Application Workbenches
      • Connectors and Drivers
      • Starter Kits
      • openCypher Support

      TIGERGRAPH DB

      • Overview
      • GSQL Query Language
      • Compare Editions

      GRAPH DATA SCIENCE

      • Graph Data Science Library
      • Machine Learning Workbench
  • Solutions
    • The World’s Fastest and Most Scalable Graph Platform

      LEARN MORE

      Watch a TigerGraph Demo

      Solutions

      • Solutions Overview

      INCREASE REVENUE

      • Customer Journey/360
      • Product Marketing
      • Entity Resolution
      • Recommendation Engine

      MANAGE RISK

      • Fraud Detection
      • Anti-Money Laundering
      • Threat Detection
      • Risk Monitoring

      IMPROVE OPERATIONS

      • Supply Chain Analysis
      • Energy Management
      • Network Optimization

      By Industry

      • Advertising, Media & Entertainment
      • Financial Services
      • Healthcare & Life Sciences

      FOUNDATIONAL

      • AI & Machine Learning
      • Time Series Analysis
      • Geospatial Analysis
  • Customers
    • The World’s Fastest and Most Scalable Graph Platform

      LEARN MORE

      CUSTOMER SUCCESS STORIES

      • Ford
      • Intuit
      • JPMorgan Chase
      • READ MORE SUCCESS STORIES
      • Jaguar Land Rover
      • United Health Group
      • Xbox
  • Partners
    • The World’s Fastest and Most Scalable Graph Platform

      LEARN MORE

      PARTNER PROGRAM

      • Partner Benefits
      • TigerGraph Partners
      • Sign Up
      TigerGraph partners with organizations that offer complementary technology solutions and services.​
  • Resources
    • The World’s Fastest and Most Scalable Graph Platform

      LEARN MORE

      BLOG

      • TigerGraph Blog

      RESOURCES

      • Resource Library
      • Benchmarks
      • Demos
      • O'Reilly Graph + ML Book

      EVENTS & WEBINARS

      • Graph+AI Summit
      • Graph for All - Million Dollar Challenge
      • Events &Trade Shows
      • Webinars

      DEVELOPERS

      • Documentation
      • Ecosystem
      • Developers Hub
      • Community Forum

      SUPPORT

      • Contact Support
      • Production Guidelines

      EDUCATION

      • Training & Certifications
  • Company
    • Join the World’s Fastest and Most Scalable Graph Platform

      WE ARE HIRING

      COMPANY

      • Company Overview
      • Leadership
      • Legal Terms
      • Patents
      • Security and Compliance

      CAREERS

      • Join Us
      • Open Positions

      AWARDS

      • Awards and Recognition
      • Leader in Forrester Wave
      • Gartner Research

      PRESS RELEASE

      • Read All Press Releases
      TigerGraph Reports Exceptional Customer Growth and Product Leadership as More Market-Leading Companies Tap the Power of Graph
      March 1, 2023
      Read More »

      NEWS

      • Read All News
      The-New-Stack-Logo-square

      Multiple Vendors Make Data and Analytics Ubiquitous

      TigerGraph enhances fundamentals in latest platform update

  • START FREE
    • The World’s Fastest and Most Scalable Graph Platform

      GET STARTED

      • Request a Demo
      • CONTACT US
      • Try TigerGraph
      • START FREE
      • TRY AN ONLINE DEMO

How the World’s Largest Banks Use Advanced Graph Analytics to Fight Fraud
  • Todd Blaschka
  • January 23, 2020
  • blog, Finance, Fraud / Anti-Money Laundering
  • Blog >
  • How the World’s Largest Banks Use Advanced Graph Analytics to Fight Fraud

Originally featured on RTInsights.com

Advanced graph analytics provides deeper insights, complementing BI, and helps organizations preempt and prevent potential fraud while protecting customers.

Financial services organizations are both powerful and vulnerable. As a result, they are often a target for fraudsters and cybercriminals. Merchants and financial services organizations will spend $9.3 billion annually on fraud detection and prevention by 2022. Global online payment fraud (also called CNP or “Card Not Present” fraud) alone will cost merchants $130 billion in just five years (from 2018 to 2023). The latest report from LexisNexis also indicates that fraud attempts have increased significantly among financial services firms during the past year, with more than twice the number of attempts and an 85 percent increase in fraud success rates.

See also: AI Brings Real-Time to Fraud Detection and Prevention

As the scale and scope of fraud has increased to encompass digital and mobile customer platforms and devices, financial services organizations are placing “fraud prevention and detection” at the top of their priority lists. In fact, five of the ten largest global banks and two of the world’s largest payment card companies have turned to advanced analytics in graph for their anti-fraud initiatives. Gartner analysts have highlighted Graph Database & Analytics as a “top 10 trend for data and analytics,” with an estimated annual growth of 100 percent annually through 2022. This technology helps analyze, detect and visualize complex data patterns – patterns that indicate the potential for fraud.

Basically, graph analytics is a set of analytic techniques that allow you to “drill down” into complex interrelationships among organizations, people and transactions. For example, a leading U.S. multinational investment bank is using advanced graph analytics to improve its fraud avoidance initiatives, specifically fraud detection for debit and credit cards. The organization is adding graph analytics to its machine learning system to find data connections between “known fraud” credit card applications and new applications. As a result, the bank can identify more questionable patterns, expose fraud rings and shut down fraudulent cards faster. The bank will then save millions of dollars annually. Also, the world’s largest payment card provider chose advanced graph analytics for payment fraud detection and merchant credit management. The company, which had been using RDBMS (relational database management system), needed technology that offered deep pattern analytics and real-time update capabilities for its anti-fraud work.

Fraud detection requires understanding connections and identifying anomalies in links among people, transactions, payment methods, locations, devices, times and more — and working with huge and ever-changing datasets to do this in real time. The world’s most innovative financial services organizations are opting for advanced analytics in graph, or advanced analytics in connected datasets (“graph” refers to connected data). Advanced analytics in graph allows a system to process a payment while understanding how a transaction is connected to different datasets. Then, a “next best action” is offered up; in the case of fraud, this may be “reject payment” while marking a user with a “zero” trust score. But there is a significant difference between regular analytics and advanced analytics – especially when it comes to detecting fraud.

Fraud Detection for Financial Services With Regular Analytics 

Let’s consider a typical payment via an online payment provider such as PayPal, Venmo, Apple or Samsung Pay to see an example of potential fraud and why it’s so difficult to detect with regular analytics.
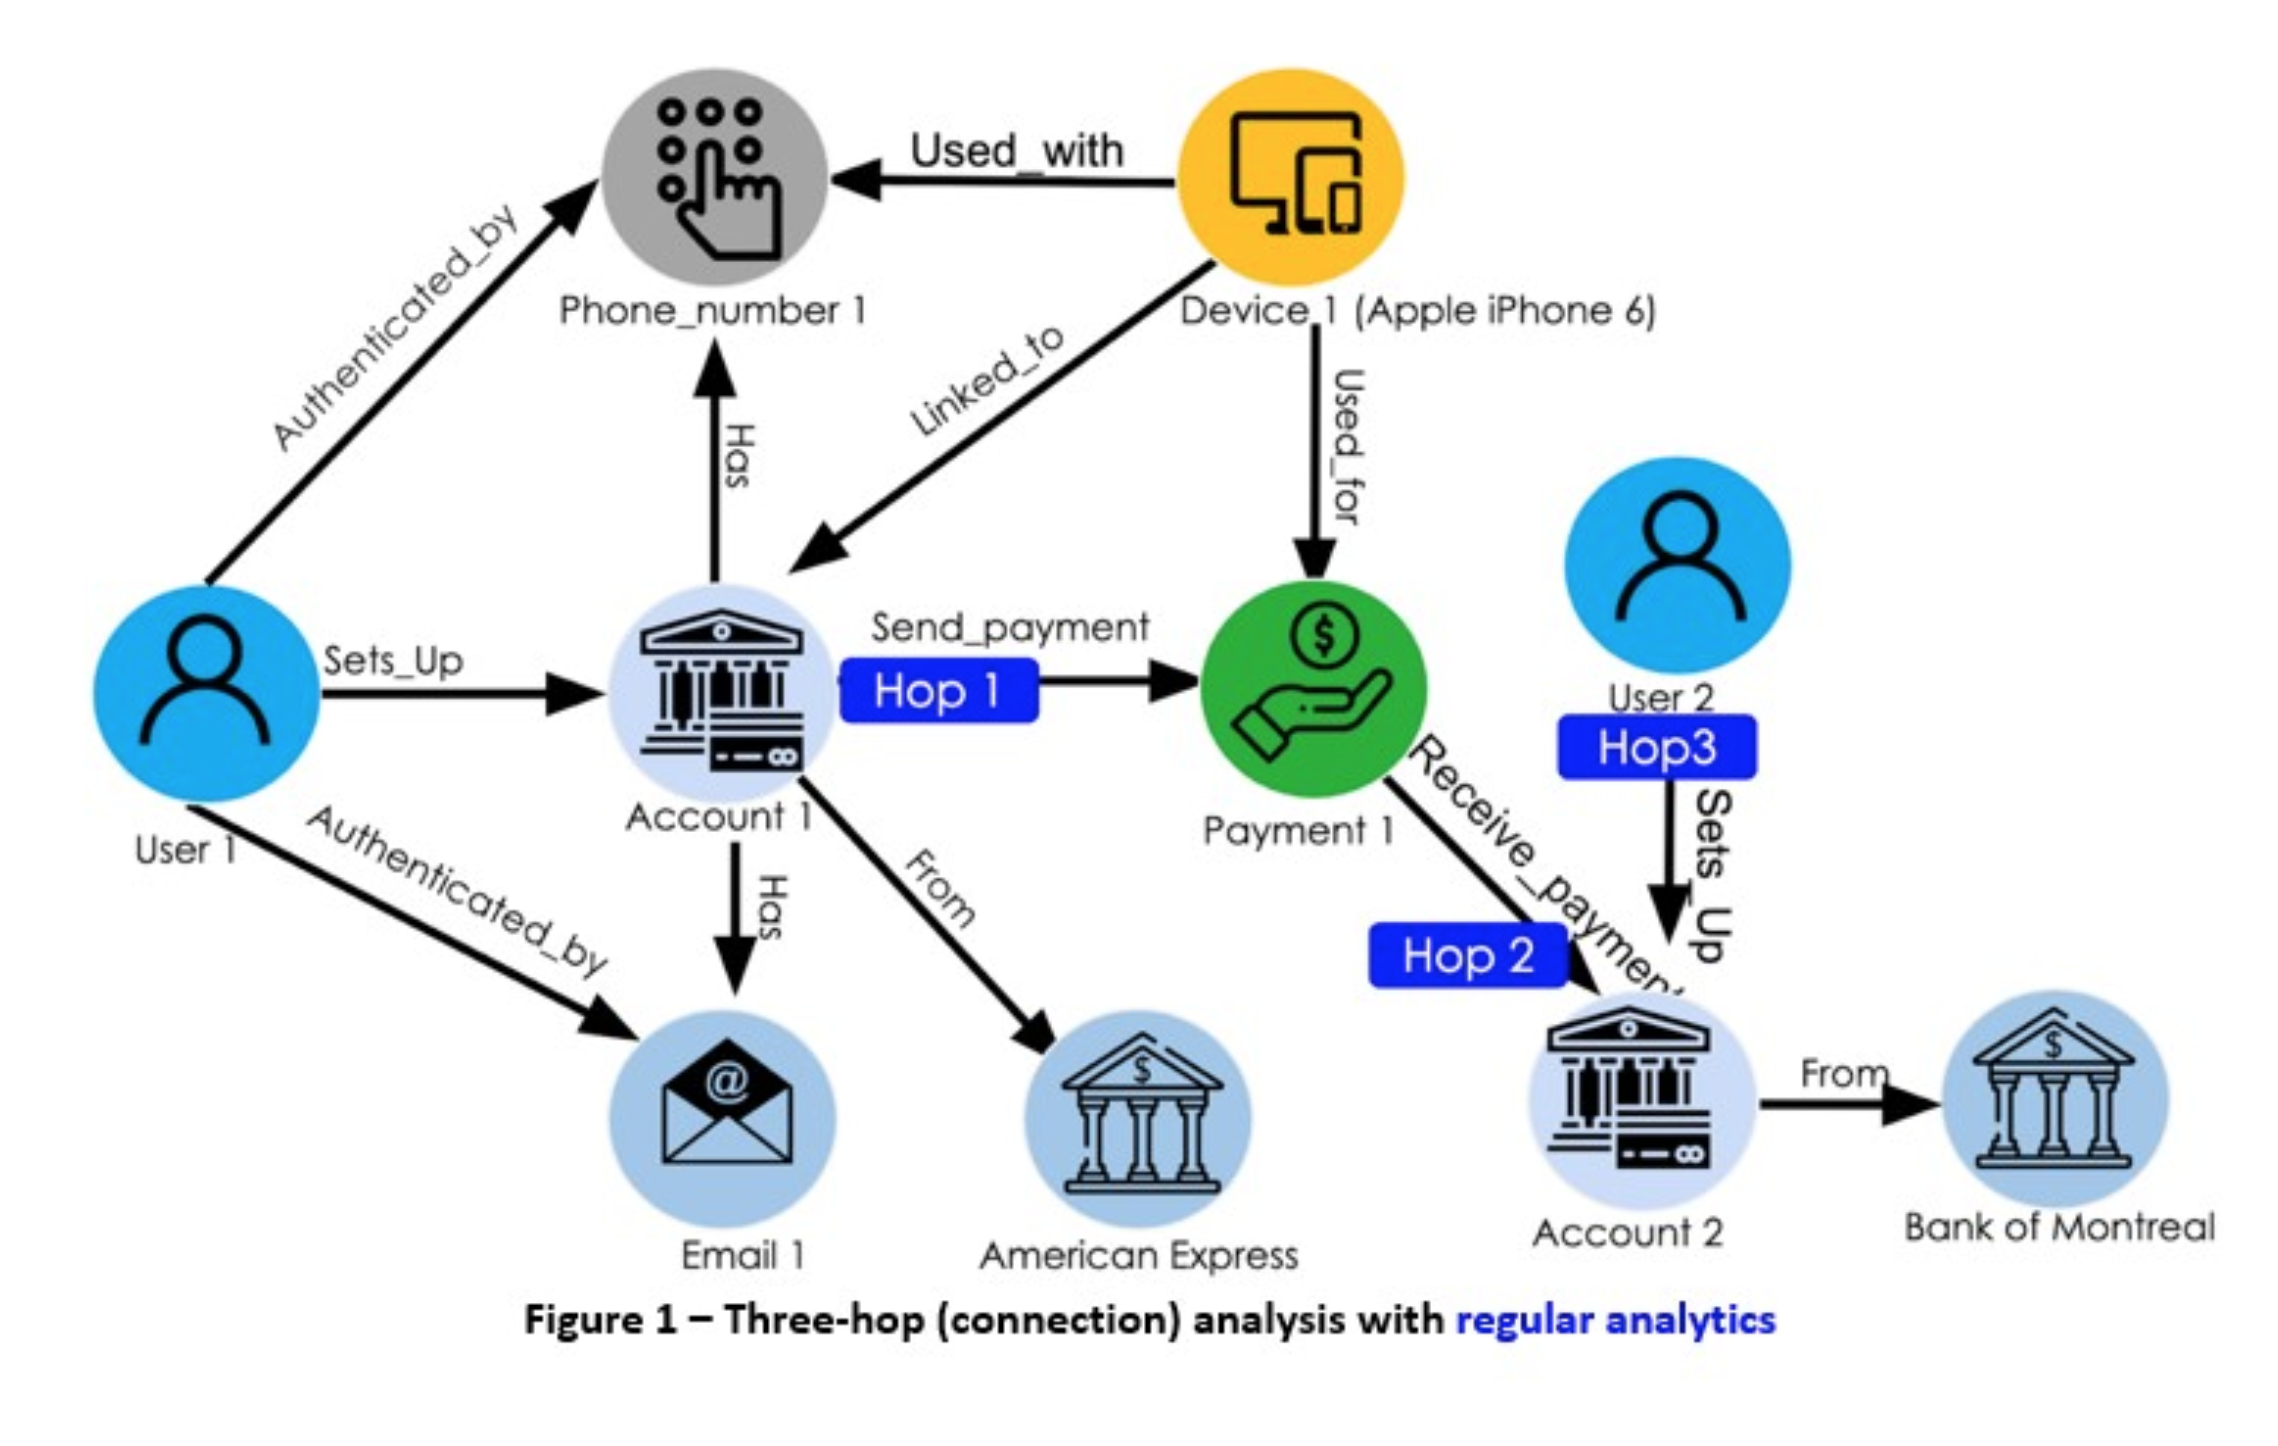
A user, “User1,” has created a new account, Account 1, which is linked to their credit card from American Express. As a part of the setup and two-factor authentication, they have linked their phone number, Phone_number 1, and their email, Email 1, to their account. User1 is using an Apple iPhone 6 as their device with the registered phone number and initiates a payment, Payment 1, for $500 to Account 2. Up to this point, there aren’t any red flags or warnings in a traditional financial services fraud detection solution, because User 1 is a brand new user, with a new phone number and email (and none of these have been associated with any fraudulent transactions in the past with the payment service). Regular analytics does not find anything unusual or suspicious and the payment goes through without being flagged or rejected.

Financial Services Fraud Detection with Advanced Analytics Powered by a Native Parallel Graph Database
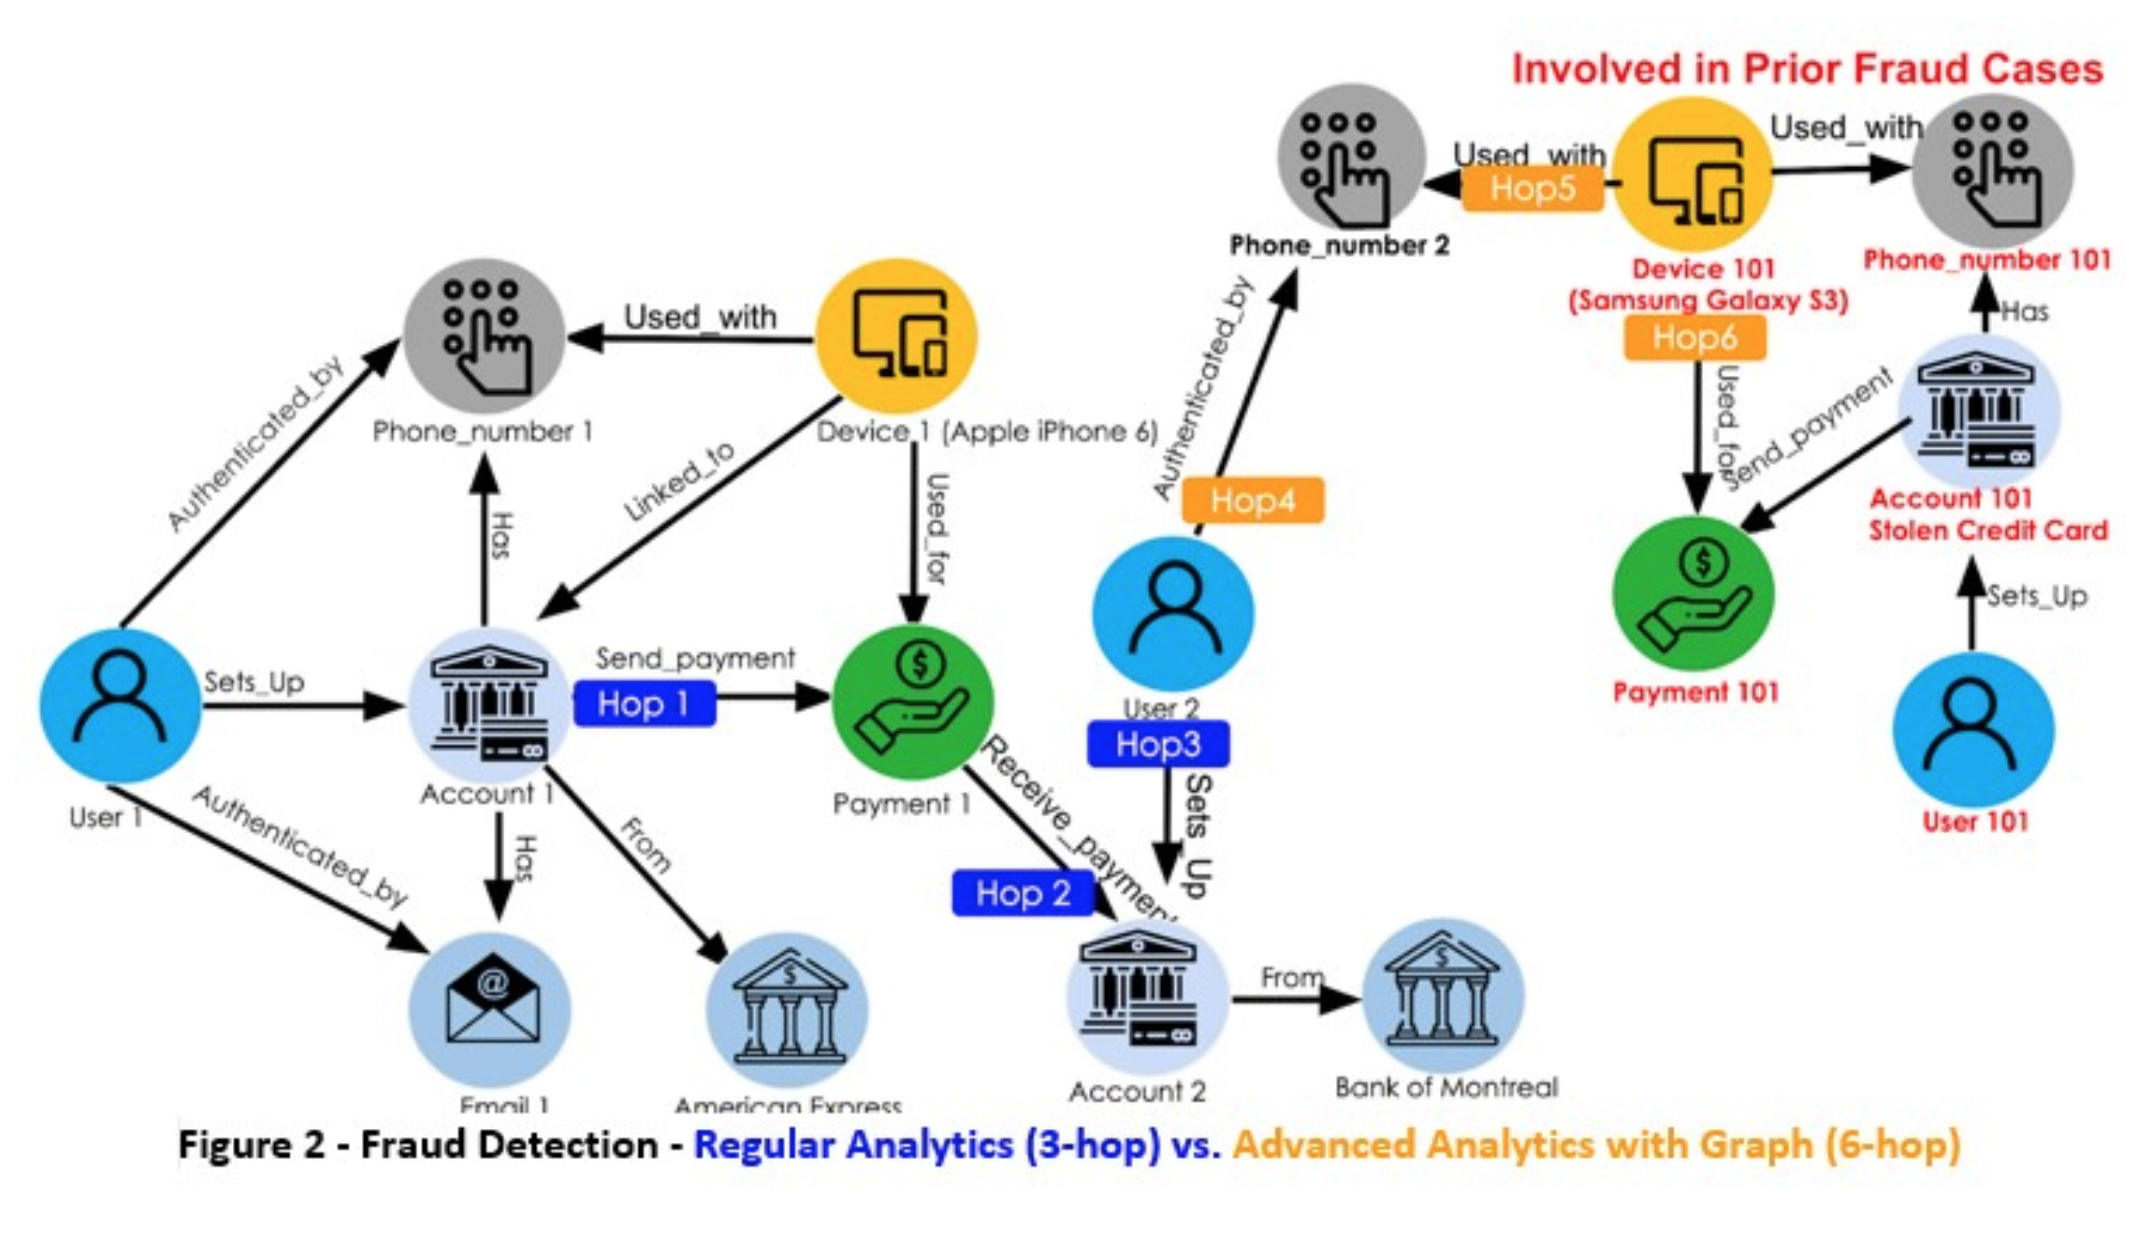
However, the deep link analysis with a native parallel graph database reveals a different picture — specifically, that — six layers in — there is  fraudulent activity associated with a device, phone number and stolen credit card. Here’s how that unravels: The recipient account for the payment, Account 2, belongs to User 2, who has authenticated the account with Phone Number 2 as part of the account setup process.  The phone number, Phone number 2, is used with Device 101, a Samsung Galaxy S3 device.  As the deep link analysis digs through the history of prior fraudulent transactions and looks for devices associated with those transactions, it finds that the Device 101 was used last year with Phone Number 101 to set up Account 101. This account, Account 101, initiated a payment, Payment 101, which was later found to be fraudulent, as Account 101 was funded by a stolen credit card.

Advanced analytics with a graph database can go deep into the connected data, in this example, six hops, or connections, deep into the dataset to find the connection to prior fraud in real time and the payment transaction is rejected as a result.

As you can see, advanced analytics is needed for real-time fraud detection for payments – and advanced analytics detects fraud three levels “deeper” than what regular analytics is capable of. This gap between regular and advanced analytics can translate to hundreds of millions of dollars lost due to fraud. Advanced analytics with real-time can process the payment transaction in sub-second response time and then runs the multi-hop connections query on the connected dataset. In other words, the system must examine every link along the journey from User 1 initiating the payment (the first hop) to the final sixth hop, the fraudulent Payment 101. And this process is a fast one – up to 100,000 payments per second. The advanced analytics must also support “real-time computation,” such as looking at the trust score for a payment to see if it’s fraudulent. Only then can the next proper action be taken (“stop payment”).

Clearly, fraud detection is top-of-mind for every financial services organization – and this is unlikely to change. As fraudsters become more tech-savvy, it’s crucial that companies stay one step ahead of them. Advanced graph analytics enables these deeper insights, complementing existing BI technology and powering AI and machine learning. The result: organizations preempt and prevent potential fraud while protecting customers (and their hard-earned dollars).`

Additional resources:

Webinar – Detecting Fraud & Anti-Money Laundering (AML) Violations In Real-Time

Demo – Anti Fraud Demo


You Might Also Like

Trillion edges benchmark: new world record beyond 100TB by TigerGraph featuring AMD based Amazon EC2 instances

Trillion edges benchmark: new world record...

March 13, 2023
Graph Databases 101: Your Top 5 Questions with Non-Technical Answers

Graph Databases 101: Your Top 5...

February 7, 2023
It’s Time to Harness the Power of Graph Technology [Infographic]

It’s Time to Harness the Power...

January 25, 2023

Introducing TigerGraph 3.0

July 1, 2020

Everything to Know to Pass your TigerGraph Certification Test

June 24, 2020

Neo4j 4.0 Fabric – A Look Behind the Curtain

February 7, 2020

TigerGraph Blog

  • Categories
    • blogs
      • About TigerGraph
      • Benchmark
      • Business
      • Community
      • Compliance
      • Customer
      • Customer 360
      • Cybersecurity
      • Developers
      • Digital Twin
      • eCommerce
      • Emerging Use Cases
      • Entity Resolution
      • Finance
      • Fraud / Anti-Money Laundering
      • GQL
      • Graph Database Market
      • Graph Databases
      • GSQL
      • Healthcare
      • Machine Learning / AI
      • Podcast
      • Supply Chain
      • TigerGraph
      • TigerGraph Cloud
    • Graph AI On Demand
      • Analysts and Research
      • Customer 360 and Entity Resolution
      • Customer Spotlight
      • Development
      • Finance, Banking, Insurance
      • Keynote
      • Session
    • Video
  • Recent Posts

    • Trillion edges benchmark: new world record beyond 100TB by TigerGraph featuring AMD based Amazon EC2 instances
    • Overview of Graph and Machine Learning with TigerGraph | Mar 8 @ 11am PST
    • Gartner Data & Analytics Summit 2023, London
    • Gartner Data and Analytics Summit, Orlando
    • Transaction Surveillance with Maximum Flow Algorithm
    TigerGraph

    Product

    SOLUTIONS

    customers

    RESOURCES

    start for free

    TIGERGRAPH DB
    • Overview
    • Features
    • GSQL Query Language
    GRAPH DATA SCIENCE
    • Graph Data Science Library
    • Machine Learning Workbench
    TIGERGRAPH CLOUD
    • Overview
    • Cloud Starter Kits
    • Login
    • FAQ
    • Pricing
    • Cloud Marketplaces
    USEr TOOLS
    • GraphStudio
    • TigerGraph Insights
    • Application Workbenches
    • Connectors and Drivers
    • Starter Kits
    • openCypher Support
    SOLUTIONS
    • Why Graph?
    industry
    • Advertising, Media & Entertainment
    • Financial Services
    • Healthcare & Life Sciences
    use cases
    • Benefits
    • Product & Service Marketing
    • Entity Resolution
    • Customer 360/MDM
    • Recommendation Engine
    • Anti-Money Laundering
    • Cybersecurity Threat Detection
    • Fraud Detection
    • Risk Assessment & Monitoring
    • Energy Management
    • Network & IT Management
    • Supply Chain Analysis
    • AI & Machine Learning
    • Geospatial Analysis
    • Time Series Analysis
    success stories
    • Customer Success Stories

    Partners

    Partner program
    • Partner Benefits
    • TigerGraph Partners
    • Sign Up
    LIBRARY
    • Resources
    • Benchmark
    • Webinars
    Events
    • Trade Shows
    • Graph + AI Summit
    • Million Dollar Challenge
    EDUCATION
    • Training & Certifications
    Blog
    • TigerGraph Blog
    DEVELOPERS
    • Developers Hub
    • Community Forum
    • Documentation
    • Ecosystem

    COMPANY

    Company
    • Overview
    • Careers
    • News
    • Press Release
    • Awards
    • Legal
    • Patents
    • Security and Compliance
    • Contact
    Get Started
    • Start Free
    • Compare Editions
    • Online Demo - Test Drive
    • Request a Demo

    Product

    • Overview
    • TigerGraph 3.0
    • TIGERGRAPH DB
    • TIGERGRAPH CLOUD
    • GRAPHSTUDIO
    • TRY NOW

    customers

    • success stories

    RESOURCES

    • LIBRARY
    • Events
    • EDUCATION
    • BLOG
    • DEVELOPERS

    SOLUTIONS

    • SOLUTIONS
    • use cases
    • industry

    Partners

    • partner program

    company

    • Overview
    • news
    • Press Release
    • Awards

    start for free

    • Request Demo
    • take a test drive
    • SUPPORT
    • COMMUNITY
    • CONTACT
    • Copyright © 2023 TigerGraph
    • Privacy Policy
    • Linkedin
    • Facebook
    • Twitter

    Copyright © 2020 TigerGraph | Privacy Policy

    Copyright © 2020 TigerGraph Privacy Policy

    • SUPPORT
    • COMMUNITY
    • COMPANY
    • CONTACT
    • Linkedin
    • Facebook
    • Twitter

    Copyright © 2020 TigerGraph

    Privacy Policy

    • Products
    • Solutions
    • Customers
    • Partners
    • Resources
    • Company
    • START FREE
    START FOR FREE
    START FOR FREE
    TigerGraph
    PRODUCT
    PRODUCT
    • Overview
    • GraphStudio UI
    • Graph Data Science Library
    TIGERGRAPH DB
    • Overview
    • Features
    • GSQL Query Language
    TIGERGRAPH CLOUD
    • Overview
    • Cloud Starter Kits
    TRY TIGERGRAPH
    • Get Started for Free
    • Compare Editions
    SOLUTIONS
    SOLUTIONS
    • Why Graph?
    use cases
    • Benefits
    • Product & Service Marketing
    • Entity Resolution
    • Customer Journey/360
    • Recommendation Engine
    • Anti-Money Laundering (AML)
    • Cybersecurity Threat Detection
    • Fraud Detection
    • Risk Assessment & Monitoring
    • Energy Management
    • Network Resources Optimization
    • Supply Chain Analysis
    • AI & Machine Learning
    • Geospatial Analysis
    • Time Series Analysis
    industry
    • Advertising, Media & Entertainment
    • Financial Services
    • Healthcare & Life Sciences
    CUSTOMERS
    read all success stories


    PARTNERS
    Partner program
    • Partner Benefits
    • TigerGraph Partners
    • Sign Up
    RESOURCES
    LIBRARY
    • Resource Library
    • Benchmark
    • Webinars
    Events
    • Trade Shows
    • Graph + AI Summit
    • Graph for All - Million Dollar Challenge
    EDUCATION
    • TigerGraph Academy
    • Certification
    Blog
    • TigerGraph Blog
    DEVELOPERS
    • Developers Hub
    • Community Forum
    • Documentation
    • Ecosystem
    COMPANY
    COMPANY
    • Overview
    • Leadership
    • Careers  
    NEWS
    PRESS RELEASE
    AWARDS
    START FREE
    Start Free
    • Request a Demo
    • SUPPORT
    • COMMUNITY
    • CONTACT
    Dr. Jay Yu

    Dr. Jay Yu | VP of Product and Innovation

    Dr. Jay Yu is the VP of Product and Innovation at TigerGraph, responsible for driving product strategy and roadmap, as well as fostering innovation in graph database engine and graph solutions. He is a proven hands-on full-stack innovator, strategic thinker, leader, and evangelist for new technology and product, with 25+ years of industry experience ranging from highly scalable distributed database engine company (Teradata), B2B e-commerce services startup, to consumer-facing financial applications company (Intuit). He received his PhD from the University of Wisconsin - Madison, where he specialized in large scale parallel database systems

    Todd Blaschka | COO

    Todd Blaschka is a veteran in the enterprise software industry. He is passionate about creating entirely new segments in data, analytics and AI, with the distinction of establishing graph analytics as a Gartner Top 10 Data & Analytics trend two years in a row. By fervently focusing on critical industry and customer challenges, the companies under Todd's leadership have delivered significant quantifiable results to the largest brands in the world through channel and solution sales approach. Prior to TigerGraph, Todd led go to market and customer experience functions at Clustrix (acquired by MariaDB), Dataguise and IBM.