


“Will our grandchildren have to choose between paying for gas and groceries and paying for healthcare?”
This is a question being asked by key leaders in the healthcare industry , as the cost of care spirals out of control worldwide. Americans spent $3.65 trillion on healthcare in 2018 based on estimates from the U. S. Federal government actuaries. That’s an increase of 4.4% over 2017 and it is estimated to accelerate to 5.5% per annum through 2027. The United States is not the only country facing this challenge: global spending on healthcare per capita is estimated to more than double by 2040.
All of this begs two key questions: what is driving the cost of healthcare to spiral upwards and how do we identify areas of improvement? To understand the root cause, let’s look at what’s involved in the cost of care while treating a healthcare condition, such as opioid addiction, an epidemic that has affected over 2 million Americans by 2018 and the number is set to rise in 2019.
Opioid addiction treatment typically requires about 90 days for residential or outpatient treatment, with methadone, a popular drug used for keeping patients sober, often being prescribed for a year or more.
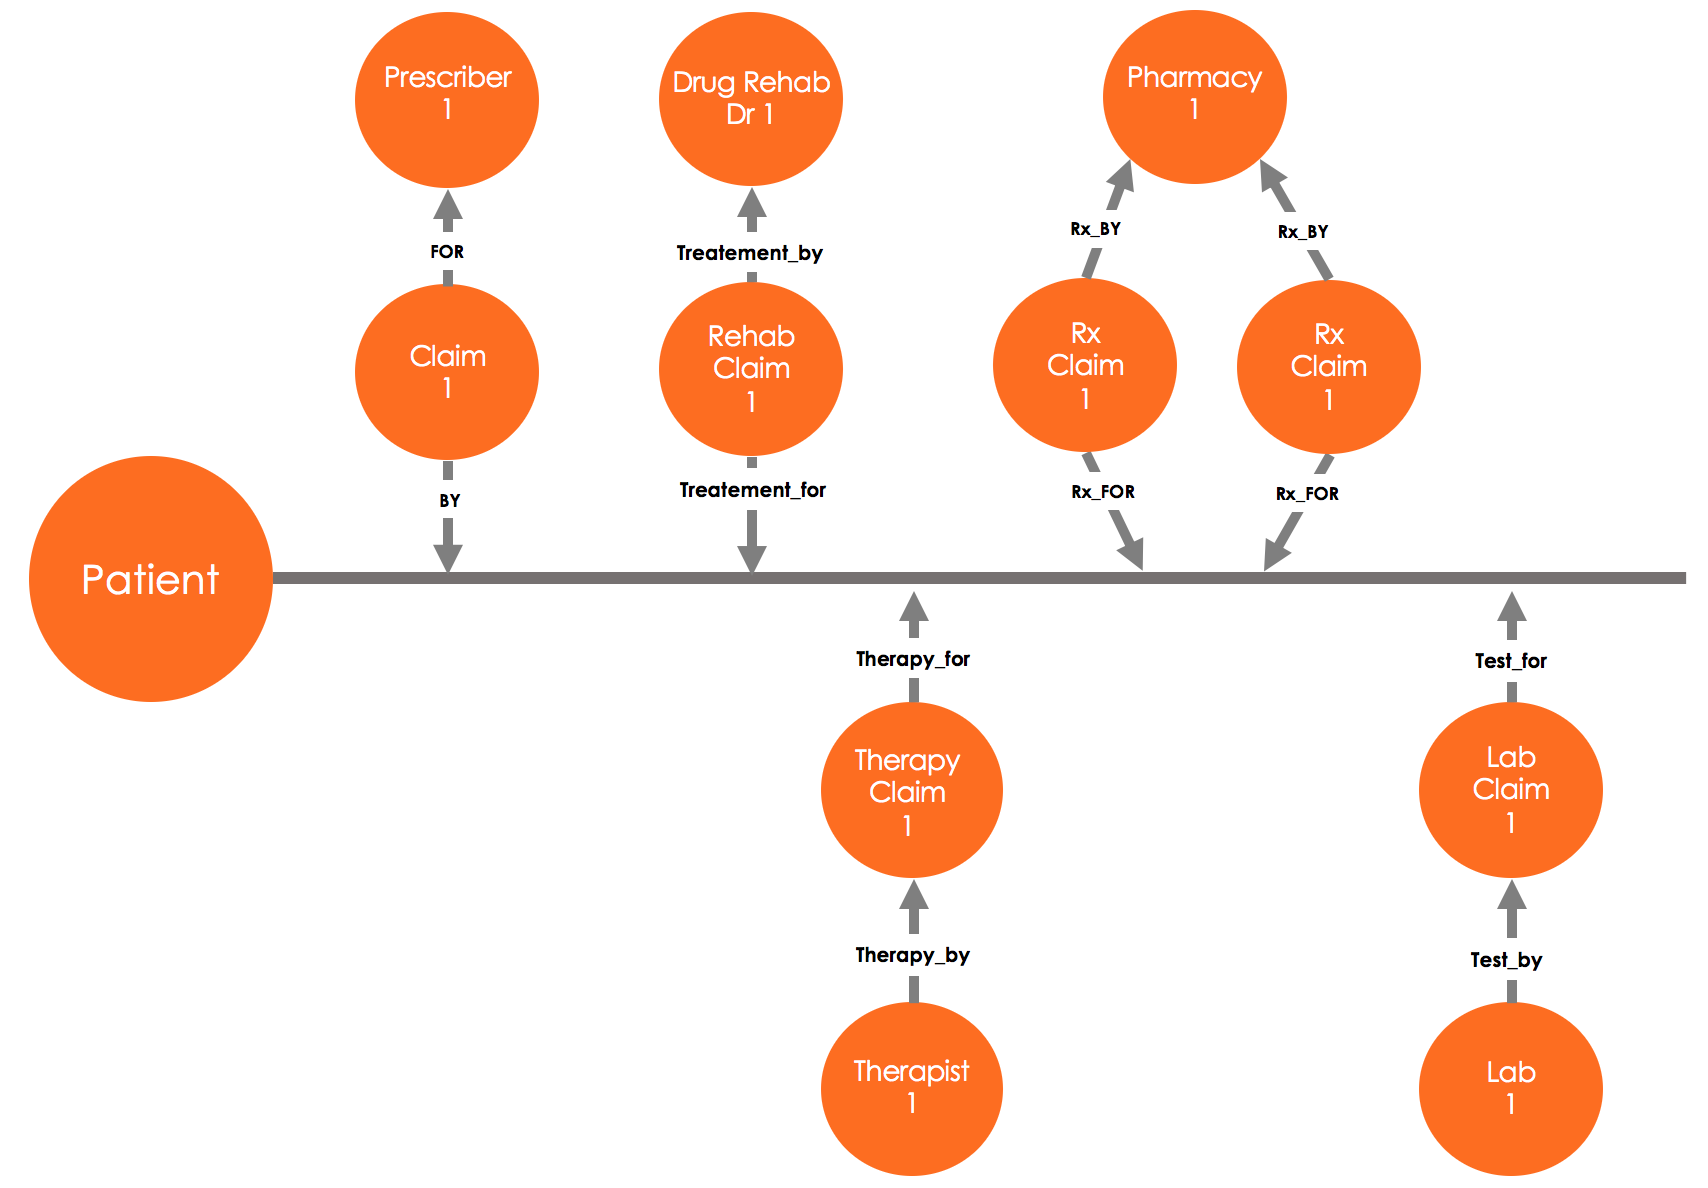
Consider the chain of claims, starting with the first claim from a general practitioner (a doctor who sees patients for routine issues, who refers the patient to a substance abuse treatment center. The physicians at the substance abuse treatment, in turn, prescribe a set of medications. resulting in pharmacy claims, order a set of initial lab tests as well as periodic urine drug tests, resulting in corresponding claims, and they may also refer the patient for cognitive behavioral therapy, resulting in the mental health/well-being claims.
At each step in this long treatment the cost increases, especially if expensive brand name drugs are prescribed instead of equally effective generic ones and unscrupulous providers refer patients to clinics that overcharge and run unnecessary tests.
Cost of care benchmarking computed with a native parallel graph database
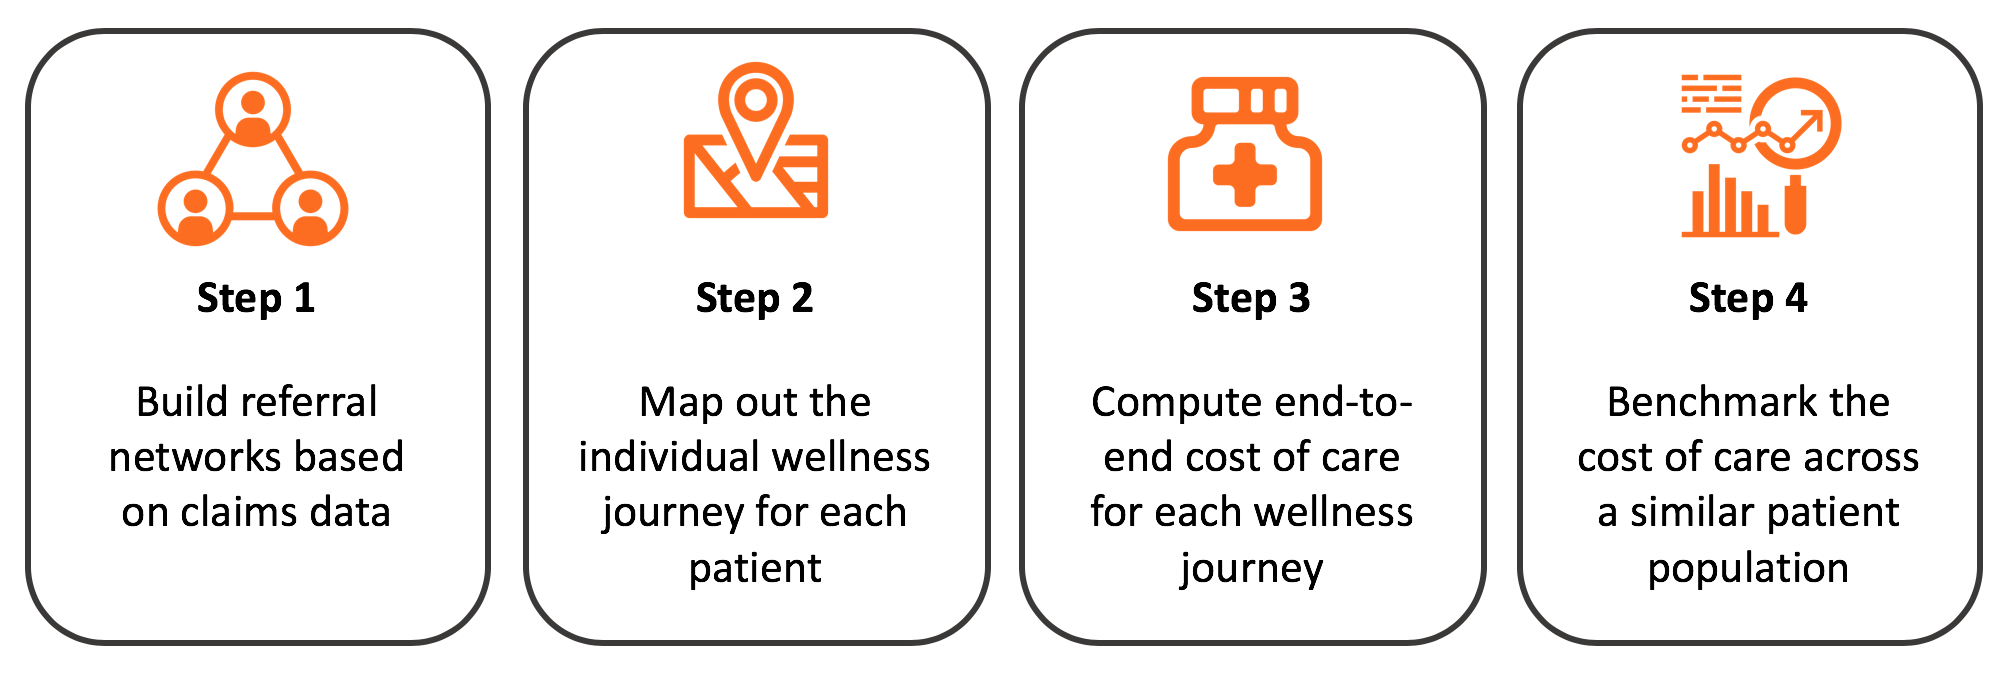
There are four steps involved in benchmarking the cost of care for a particular condition, such as opioid addiction, the first being building referral networks based on the claims data, then mapping out the individual wellness journey for each patient, then computing the end-to-end cost of care for each wellness journey and lastly benchmarking the cost of care across a similar patient population
This process can be difficult for a variety of reasons, not least of which the disparate nature of much of the data it requires, especially when this data is stored in different silos. Fortunately, a native parallel graph database is purpose-built to address all four steps:
Step 1: Build referral networks based on the claims data – the first step is to build out the referral network among the first prescriber (such as a general practitioner) visited by the patient, and all the follow-on providers including other prescribers, pharmacies, laboratories, substance abuse treatment centers and mental health professionals. As each claim typically has only one prescriber and most do not have the referring physician information, the graph-based analytics traverses the claims within a predefined window (such as two or four weeks), finds claims for the common patients and links those with an inferred referral relationship.
Step 2: Map out the individual wellness journey for each patient – the second step is to map out the wellness journey for each patient using as many as 50+ claims that are part of the treatment following the initial diagnosis and the patient referral to substance abuse treatment center. This is very cumbersome to do with relational databases as it requires a wide join across multiple tables including the claims of different types (pharmacy, lab, mental health, treatment, and so on), facilities table with pharmacies, substance abuse treatment centers and lab and tables containing the prescribers and mental healthcare professionals. A native parallel graph with pre-connected business entities simply traverses the connections, mapping out the wellness journey for each patient with a specific healthcare condition.
Step 3: Compute the end-to-end cost of care for each wellness journey – the third step is to add up the cost of care across all claims This is where having a parallel graph database is key as it can add up the cost of care for millions of patients across the entire dataset with parallel threads for traversal and computing.
Step 4: Benchmark the cost of care across a similar patient population – the final step is to benchmark the cost care across similar patients (in terms of age, gender, initial diagnosis, and final outcome) and for referral networks for the prescribers. This process will reveal interesting insights such as the cost of opioid addiction treatment in Northern California is $25,000 per month, per patient with an average treatment period of 6 months, bringing the total cost to $150,000 for the entire wellness journey.
Prescriber 1 and their referral network in East San Jose have the cost of care of opioid addiction treatment of $20,000 per month (80% of the average), per patient with an average treatment period of 5 months resulting in $100,000 (66% of the average). The healthcare outcome for prescriber 1, which is measured by recidivism rate (patients who begin abusing opioids and need to be treated again), is half of the benchmark for the similar patient population – clearly, Prescriber 1 and their referral networks have found new ways of treating opioid addictions with lower cost of care and improved outcomes and should be contacted to understand the best practices. These best practices are then shared with all the prescribers to drive down the cost of care across the network!
Prescriber 2 and their referral network in East San Jose has the cost of care of opioid addiction treatment of $40,000 per month (160% of the average), per patient an average treatment period of 8 months resulting in $320,000 (210% of the average). The healthcare outcome for Prescriber 1 and their referral network, the recidivism rate for the patients is average, so clearly further analysis is needed to see if they are prescribing unnecessary medications, tests or treatment or there’s fraud or abuse in play in terms of over billing the insurance.
The ability to benchmark the cost of treatment, such as opioid addiction, is an important analytical tool for payers wanting to improve the costs of healthcare. A native parallel graph, is the ideal way to do so.
Power your cost of care benchmarking initiatives with TigerGraph, the leading provider of native parallel graphs. TigerGraph Cloud has an application starter kit for the healthcare industry focused on referral networks and can be easily extended to add the cost of care benchmarking computations. TigerGraph Cloud is free to get started and you can experience the power of the starter kit in just five minutes by registering at https://www.tigergraph.com/cloud


