


Using TigerGraph and Synthea to Create a Synthetic Healthcare System
by Akash Kaul, originally posted on Towards Data Science
Introduction
Since the transition from paper records to virtual records, hospitals have been piling up data. Every touchpoint of the healthcare system, every prescription, operation, and immunization, is logged and stored in the hospital’s electronic health record (EHR). It has now reached a point where hospitals have more data than they know what to do with. Even worse, this oversaturation of complex data makes accessing and analyzing the data extremely inefficient.
So, what’s the solution to this crisis?
Graph Databases!
Graphs are perfect for storing and visualizing healthcare data models. They are designed to handle highly connected information, like patient records. If you are unfamiliar with graphs, check out this awesome article that introduces some of the basics of graph theory.
I’ll be walking through an example of how we can use a TigerGraph graph database to represent complex healthcare data. Let’s get started!
Generating the Data
In an ideal world, we could create this graph using real patient data; however, there are a number of rules and regulations that make working with patient data pretty hard. Instead, we can use the next best thing: synthetic data.
Using Synthea, an open-source synthetic patient generator, we can create an entire healthcare ecosystem full of patients, hospital visits, insurance providers, and everything else you could think of. If you’ve never encountered Synthea before, check out this short post I wrote explaining how it works.
The output data from Synthea is divided into several CSV files such as Allergies, Medications, Encounters, Providers, etc.
Some CSV files have column headers that aren’t obvious indicators of the column data. It helps to look at the Synthea Wiki to see the contents of each file.
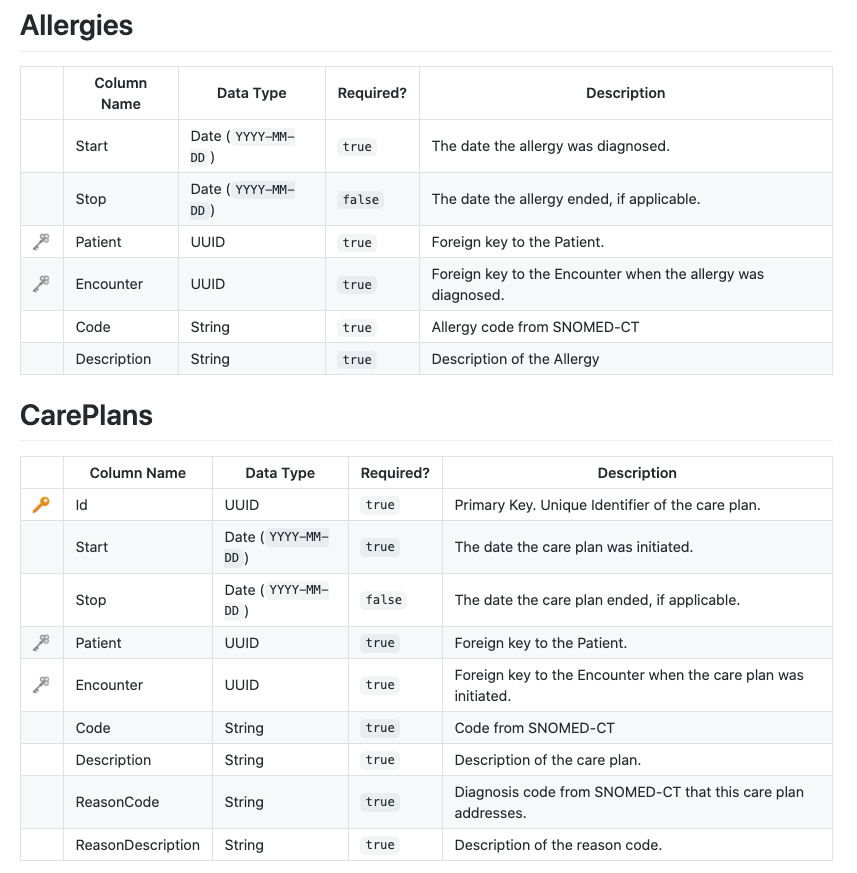
The columns of the actual CSV files correspond exactly to the documentation.
For this example healthcare system, I generated a sample of 500 patients from across the US.
Creating a Graph Schema
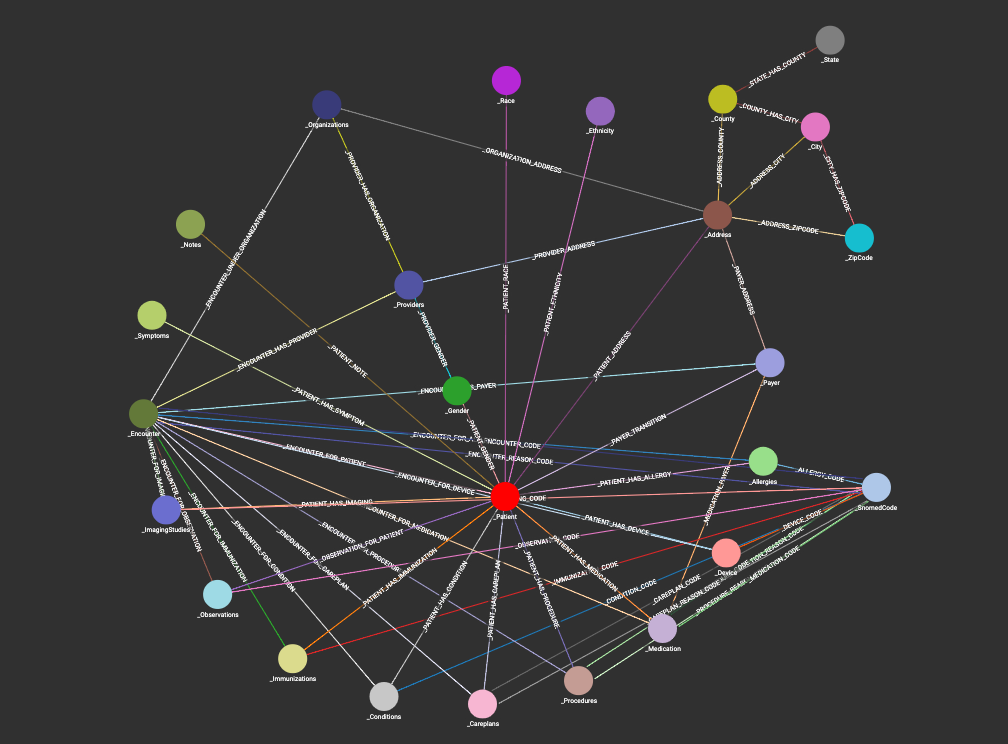
The schema for this graph is quite complex (as you can see from the picture). And I say that not to intimidate you, but to highlight what I’ve already said.
HEALTHCARE DATA IS COMPLEX!
Each patient has so many interactions with the healthcare system, a simple schema would most certainly fail to capture all of the data and information available. Our schema must be as detailed as our data.
We can create our schema using the TigerGraph-native language GSQL. The entire script looks like this:
CREATE VERTEX Gender(PRIMARY_ID gender_id STRING) WITH primary_id_as_attribute="true"

CREATE VERTEX Race(PRIMARY_ID race_id STRING) WITH primary_id_as_attribute="true"

CREATE VERTEX Ethnicity(PRIMARY_ID ethnicity_id STRING) WITH primary_id_as_attribute="true"

CREATE VERTEX Address(PRIMARY_ID address_id STRING, name STRING, lat DOUBLE, lon DOUBLE) WITH primary_id_as_attribute="true"

CREATE VERTEX City(PRIMARY_ID city_id STRING) WITH primary_id_as_attribute="true"

CREATE VERTEX State(PRIMARY_ID state_id STRING) WITH primary_id_as_attribute="true"

CREATE VERTEX County(PRIMARY_ID county_id STRING) WITH primary_id_as_attribute="true"

CREATE VERTEX ZipCode(PRIMARY_ID zip_id STRING) WITH primary_id_as_attribute="true"

CREATE VERTEX SnomedCode(PRIMARY_ID snomed_code STRING, description STRING) WITH primary_id_as_attribute="true"

CREATE VERTEX Patient(PRIMARY_ID patient_id STRING, lastName STRING, firstName STRING, maiden STRING,
                      birthday DATETIME, ssn STRING, license STRING, passport STRING,
                      healthcareExpense DOUBLE, healthcareCoverage DOUBLE, suffix STRING, prefix STRING, maritalStatus STRING, birthplace STRING) WITH primary_id_as_attribute="true"

CREATE VERTEX Allergies(PRIMARY_ID allergy_id STRING, allergy_code STRING, description STRING, startDate DATETIME, endDate DATETIME) WITH primary_id_as_attribute="true"

CREATE VERTEX Device(PRIMARY_ID UDI_code STRING, description STRING, startDate DATETIME, endDate DATETIME) WITH primary_id_as_attribute="true"

CREATE VERTEX Medication(PRIMARY_ID medication_id STRING, medication_code STRING, description STRING, startDate DATETIME, endDate DATETIME, baseCost DOUBLE, payerCoverage DOUBLE, dispenses INT, totalCost DOUBLE) WITH primary_id_as_attribute="true"

CREATE VERTEX Procedures(PRIMARY_ID procedure_id STRING, procedure_code STRING, description STRING, baseCost INT, dateOfProcedure DaTETIME) WITH primary_id_as_attribute="true"

CREATE VERTEX Careplans(PRIMARY_ID careplan_id STRING, description STRING, startDate DATETIME, endDate DATETIME) WITH primary_id_as_attribute="true"

CREATE VERTEX Conditions(PRIMARY_ID condition_id STRING, condition_code STRING, description STRING, startDate DATETIME, endDate DATETIME) WITH primary_id_as_attribute="true"

CREATE VERTEX Immunizations(PRIMARY_ID immunization_id STRING, immunization_code STRING, description STRING, dateOfImmunization DATETIME, baseCost DOUBLE) WITH primary_id_as_attribute="true"

CREATE VERTEX Observations(PRIMARY_ID observation_id STRING, dateOfObservation DATETIME, observation_code STRING, description STRING, obsValue STRING, units STRING) WITH primary_id_as_attribute="true"

CREATE VERTEX Organizations(PRIMARY_ID organization_id STRING, name STRING, revenue DOUBLE, utilization INT, phone STRING) WITH primary_id_as_attribute="true"

CREATE VERTEX Providers(PRIMARY_ID provider_id STRING, name STRING, utilization INT, speciality STRING) WITH primary_id_as_attribute="true"

CREATE VERTEX ImagingStudies(PRIMARY_ID imaging_id STRING, bodySiteCode STRING, bodySiteDescription STRING, modalityCode STRING,
                            modalityDescription STRING, SOPCode STRING, SOPDescription STRING, dateOfImage DATETIME) WITH primary_id_as_attribute="true"

CREATE VERTEX Payer(PRIMARY_ID payer_id STRING, name STRING, phone STRING, amountCovered DOUBLE, amountUncovered DOUBLE, revenue DOUBLE,
                    coveredEncounters INT, uncoveredEncounters INT, coveredMedications INT, uncoveredMedications INT,
                    coveredProcedures INT, uncoveredProcedures INT, coveredImmunizations INT, uncoveredImmunizations INT,
                    uniqueCustomers INT, QOLS_Avg DOUBLE, memberMonths INT) WITH primary_id_as_attribute="true"
CREATE VERTEX Encounter(PRIMARY_ID encounter_id STRING, baseEncounterCost DOUBLE, totalClaimCost DOUBLE, payerCoverage DOUBLE, classType STRING, startTime DATETIME, endTime DATETIMe) WITH primary_id_as_attribute="true"

CREATE VERTEX Notes(PRIMARY_ID note_id STRING, chiefComplaint STRING, historyOfPresentIllness STRING, socialHistory STRING, allergies STRING, medications STRING, assessment STRING, plan STRING, dateOfNote DATETIME) with primary_id_as_attribute="true"

CREATE VERTEX Symptoms(PRIMARY_ID symptom_id STRING, symptom STRING, symptomValue INT, pathology STRING, ageBegin INT, ageEnd INT) with primary_id_as_attribute="true"

CREATE UNDIRECTED EDGE PATIENT_HAS_SYMPTOM(From Patient, To Symptoms)

CREATE UNDIRECTED EDGE PATIENT_NOTE(FROM Patient, to Notes)

CREATE UNDIRECTED EDGE ADDRESS_CITY(From Address, To City)
CREATE UNDIRECTED EDGE ADDRESS_COUNTY(From Address, To County)
CREATE UNDIRECTED EDGE ADDRESS_ZIPCODE(From Address, To ZipCode)
CREATE UNDIRECTED EDGE STATE_HAS_COUNTY(From State, To County)
CREATE UNDIRECTED EDGE COUNTY_HAS_CITY(From County, To City)
CREATE UNDIRECTED EDGE CITY_HAS_ZIPCODE(From City, To ZipCode)

CREATE UNDIRECTED EDGE PATIENT_GENDER(FROM Patient, TO Gender)
CREATE UNDIRECTED EDGE PATIENT_ADDRESS(FROM Patient, To Address)
CREATE UNDIRECTED EDGE PATIENT_RACE(FROM Patient, TO Race)
CREATE UNDIRECTED EDGE PATIENT_ETHNICITY(FROM Patient, TO Ethnicity)

CREATE UNDIRECTED EDGE PATIENT_HAS_ALLERGY(FROM Allergies, to Patient)
Create UNDIRECTED EDGE ENCOUNTER_FOR_ALLERGY(FROM Allergies, TO Encounter)
CREATE UNDIRECTED EDGE ALLERGY_CODE(FROM Allergies, TO SnomedCode)

CREATE UNDIRECTED EDGE PATIENT_HAS_DEVICE(FROM Device, TO Patient)
CREATE UNDIRECTED EDGE ENCOUNTER_FOR_DEVICE(FROM Device, TO Encounter)
CREATE UNDIRECTED EDGE DEVICE_CODE(FROM Device, TO SnomedCode)

CREATE UNDIRECTED EDGE PATIENT_HAS_MEDICATION(FROM Medication, TO Patient)
CREATE UNDIRECTED EDGE MEDICATION_PAYER(FROM Medication, TO Payer)
CREATE UNDIRECTED EDGE ENCOUNTER_FOR_MEDICATION(FROM Medication, TO Encounter)
CREATE UNDIRECTED EDGE MEDICATION_REASON_CODE(FROM Medication, TO SnomedCode)
CREATE UNDIRECTED EDGE MEDICATION_CODE(FROM Medication, To SnomedCode)

CREATE UNDIRECTED EDGE PROCEDURE_CODE(FROM Procedures, To SnomedCode)
CREATE UNDIRECTED EDGE PROCEDURE_REASON_CODE(FROM Procedures, To SnomedCode)
CREATE UNDIRECTED EDGE PATIENT_HAS_PROCEDURE(FROM Procedures, To Patient)
CREATE UNDIRECTED EDGE ENCOUNTER_FOR_PROCEDURE(FROM Procedures, To Encounter)

CREATE UNDIRECTED EDGE PATIENT_HAS_CAREPLAN(FROM Careplans, TO Patient)
CREATE UNDIRECTED EDGE ENCOUNTER_FOR_CAREPLAN(FROM Careplans, TO Encounter)
CREATE UNDIRECTED EDGE CAREPLAN_CODE(FROM Careplans, TO SnomedCode)
CREATE UNDIRECTED EDGE CAREPLAN_REASON_CODE(FROM Careplans, TO SnomedCode)

CREATE UNDIRECTED EDGE PATIENT_HAS_CONDITION(FROM Conditions, TO Patient)
CREATE UNDIRECTED EDGE ENCOUNTER_FOR_CONDITION(FROM Conditions, TO Encounter)
CREATE UNDIRECTED EDGE CONDITION_CODE(FROM Conditions, TO SnomedCode)

CREATE UNDIRECTED EDGE PATIENT_HAS_IMMUNIZATION(FROM Immunizations, TO Patient)
CREATE UNDIRECTED EDGE ENCOUNTER_FOR_IMMUNIZATION(FROM Immunizations, TO Encounter)
CREATE UNDIRECTED EDGE IMMUNIZATION_CODE(FROM Immunizations, TO SnomedCode)

CREATE UNDIRECTED EDGE OBSERVATION_FOR_PATIENT(FROM Observations, TO Patient)
CREATE UNDIRECTED EDGE ENCOUNTER_FOR_OBSERVATION(FROM Observations, TO Encounter)
CREATE UNDIRECTED edge OBSERVATION_CODE(From Observations, To SnomedCode)

CREATE UNDIRECTED EDGE ORGANIZATION_ADDRESS(From Organizations, To Address)

CREATE UNDIRECTED EDGE PROVIDER_HAS_ORGANIZATION(FROM Providers, TO Organizations)
CREATE UNDIRECTED EDGE PROVIDER_GENDER(FROM Providers, TO Gender)
CREATE UNDIRECTED EDGE PROVIDER_ADDRESS(From Providers, To Address)

CREATE UNDIRECTED EDGE PATIENT_HAS_IMAGING(FROM ImagingStudies, TO Patient)
CREATE UNDIRECTED EDGE ENCOUNTER_FOR_IMAGING(FROM ImagingStudies, TO Encounter)
CREATE UNDIRECTED EDGE IMAGING_CODE(FROM ImagingStudies, TO SnomedCode)

CREATE UNDIRECTED EDGE PAYER_TRANSITION(FROM Payer, TO Patient, startYear DATETIME, endYear DATETIME, ownership STRING)
CREATE UNDIRECTED EDGE PAYER_ADDRESS(From Payer, To Address)

CREATE UNDIRECTED EDGE ENCOUNTER_FOR_PATIENT(FROM Encounter, TO Patient)
CREATE UNDIRECTED EDGE ENCOUNTER_UNDER_ORGANIZATION(FROM Encounter, TO Organizations)
CREATE UNDIRECTED EDGE ENCOUNTER_HAS_PROVIDER(FROM Encounter, TO Providers)
CREATE UNDIRECTED EDGE ENCOUNTER_HAS_PAYER(FROM Encounter, TO Payer)
CREATE UNDIRECTED EDGE ENCOUNTER_CODE(FROM Encounter, TO SnomedCode)
CREATE UNDIRECTED EDGE ENCOUNTER_REASON_CODE(FROM Encounter, TO SnomedCode)

CREATE Graph synthea(Gender, Race, Ethnicity, Address, City, State, County, ZipCode, SnomedCode, Patient, Allergies, Device, Medication, Procedures,
                        Careplans, Conditions, Immunizations, Observations, Organizations, Providers, ImagingStudies, Payer, Encounter, Notes, Symptoms,
                        PATIENT_HAS_SYMPTOM, PATIENT_NOTE, ADDRESS_CITY, ADDRESS_COUNTY, ADDRESS_ZIPCODE, STATE_HAS_COUNTY, COUNTY_HAS_CITY, CITY_HAS_ZIPCODE, PATIENT_GENDER,
                        PATIENT_ADDRESS, PATIENT_RACE, PATIENT_ETHNICITY, PATIENT_HAS_ALLERGY, ENCOUNTER_FOR_ALLERGY, ALLERGY_CODE,
                        PATIENT_HAS_DEVICE, ENCOUNTER_FOR_DEVICE, DEVICE_CODE, PATIENT_HAS_MEDICATION, MEDICATION_PAYER, ENCOUNTER_FOR_MEDICATION,
                        MEDICATION_REASON_CODE, MEDICATION_CODE, PROCEDURE_CODE, PROCEDURE_REASON_CODE, PATIENT_HAS_PROCEDURE, ENCOUNTER_FOR_PROCEDURE,
                        PATIENT_HAS_CAREPLAN, ENCOUNTER_FOR_CAREPLAN, CAREPLAN_CODE, CAREPLAN_REASON_CODE, PATIENT_HAS_CONDITION, ENCOUNTER_FOR_CONDITION,
                        CONDITION_CODE, PATIENT_HAS_IMMUNIZATION, ENCOUNTER_FOR_IMMUNIZATION, IMMUNIZATION_CODE, OBSERVATION_FOR_PATIENT, ENCOUNTER_FOR_OBSERVATION,
                        OBSERVATION_CODE, ORGANIZATION_ADDRESS, PROVIDER_HAS_ORGANIZATION, PROVIDER_GENDER, PROVIDER_ADDRESS, PATIENT_HAS_IMAGING, ENCOUNTER_FOR_IMAGING,
                        IMAGING_CODE, PAYER_TRANSITION, PAYER_ADDRESS, ENCOUNTER_FOR_PATIENT, ENCOUNTER_UNDER_ORGANIZATION, ENCOUNTER_HAS_PROVIDER, ENCOUNTER_HAS_PAYER,
                        ENCOUNTER_CODE, ENCOUNTER_REASON_CODE)
I could write an entire blog on this script alone. But, in the interest of sparing you from having to read what would surely be a very boring read, I’ll just note some key points.
- Each CSV file topic becomes a vertex with the appropriate edges.
- All of the edges are undirected because all relationships are bi-directional (i.e. a patient has a medication, but that medication then corresponds to that patient.)
- Attributes like gender, race, and address could be internal attributes, but I chose to break them out to optimize searches around those attributes.
- The vertex SnomedCode stores every medical code used, which also helps to optimize searches
Loading the Data
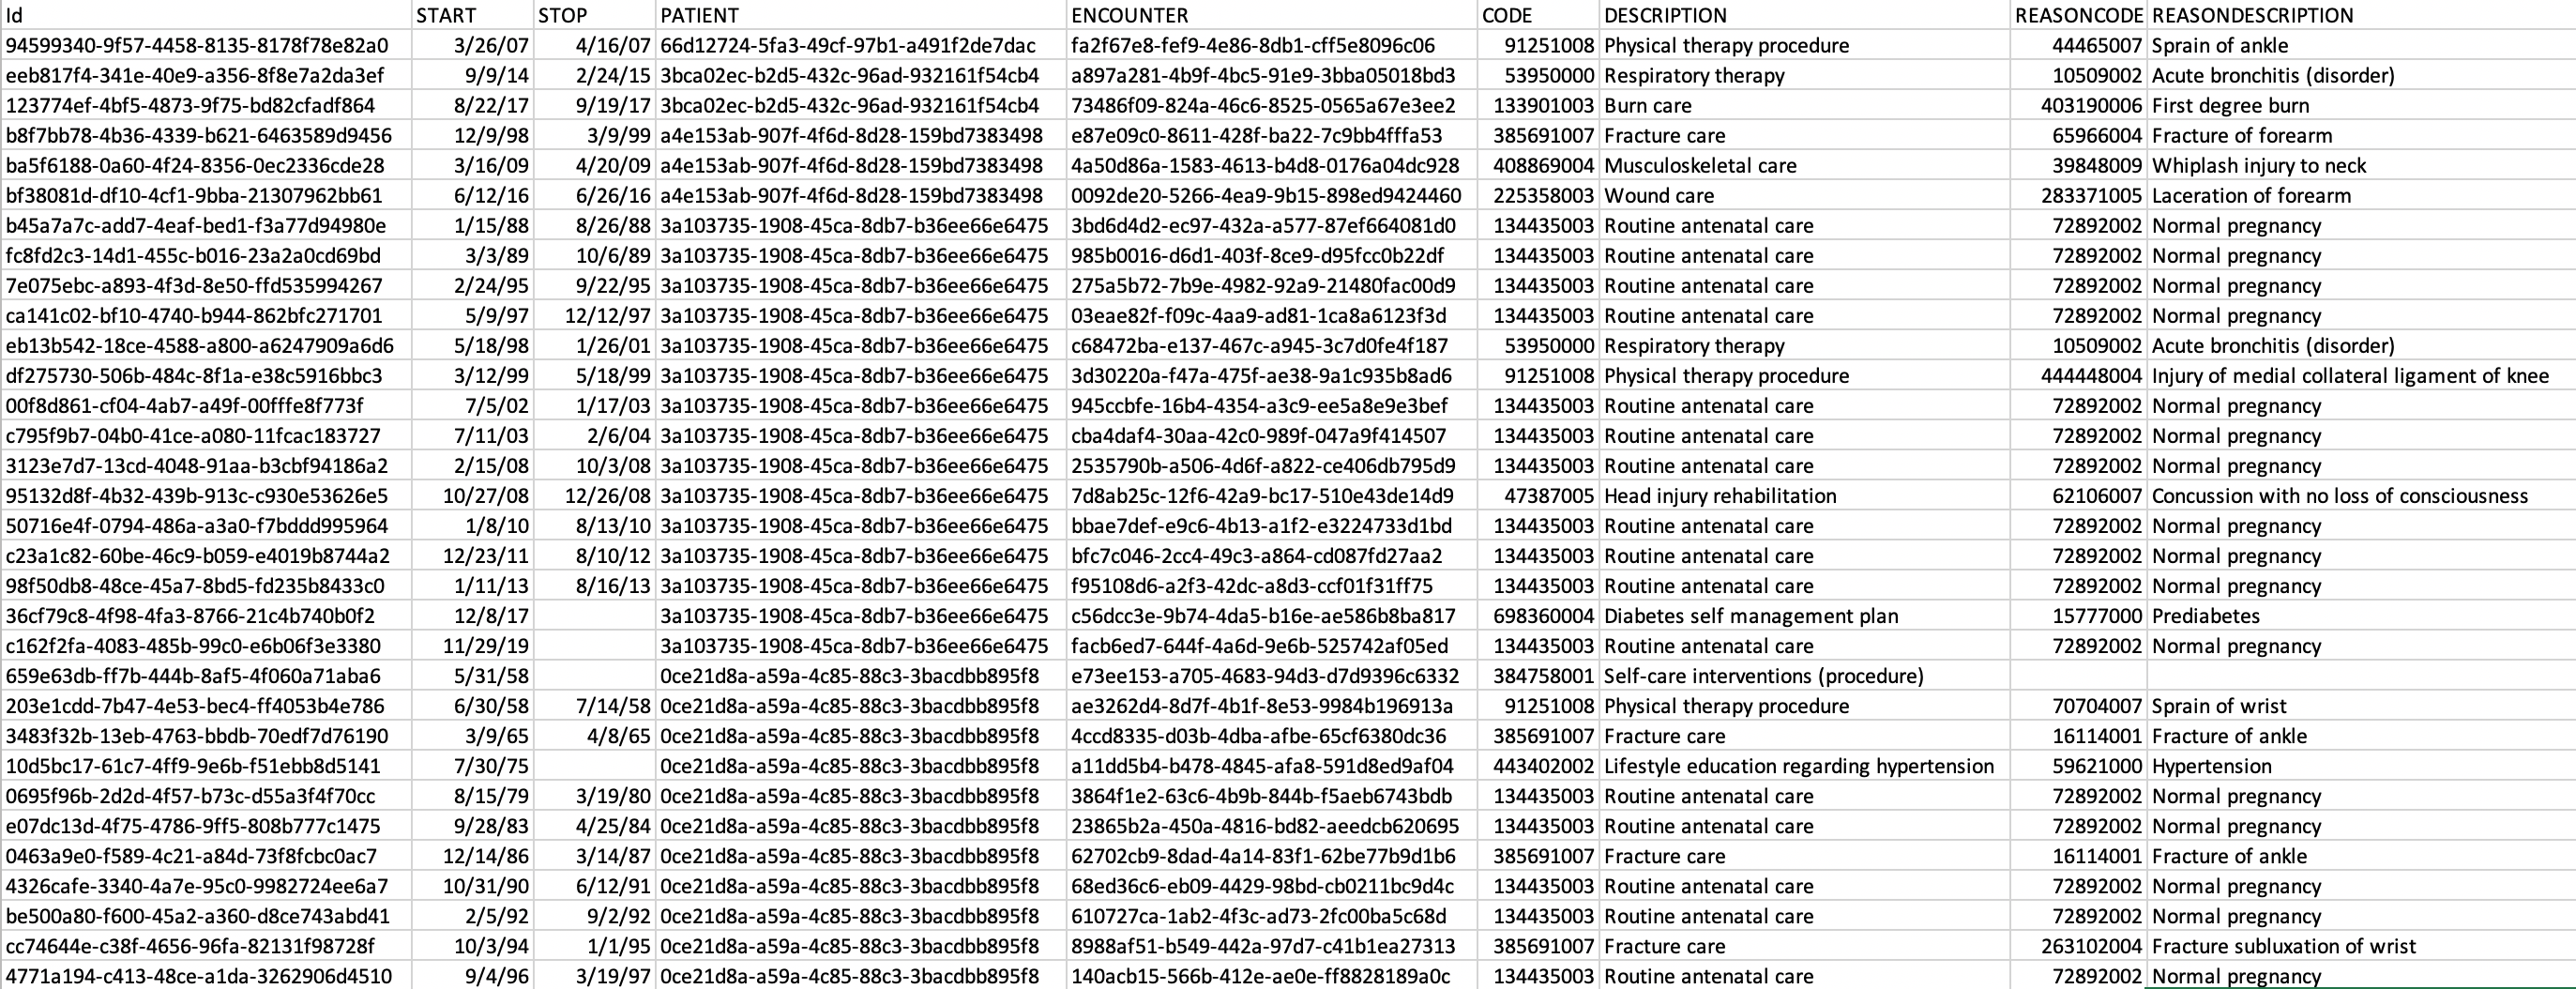
We can write GSQL loading scripts to load in our data. Let’s look at the example loading script for the CarePlans CSV file.
create loading job loadCareplans for graph synthea {
/* load careplan csv into appropriate vertices & edges */

    define filename f1 = 'path/to/file.csv';

    load f1
        to vertex Careplans values ($0, $6, $1, $2),
        to vertex SnomedCode values ($5, $6),
        to vertex SnomedCode values ($7, $8),
        to edge PATIENT_HAS_CAREPLAN values ($0, $3),
        to edge ENCOUNTER_FOR_CAREPLAN values ($0, $4),
        to edge CAREPLAN_CODE values ($0, $5),
        to edge CAREPLAN_REASON_CODE values ($0, $7)
        using header="true", separator=",";
}
Again, let’s briefly take a look at the important parts of this code.
- We first define the file that we are using to load our data.
- We then specify which columns correspond to the vertex ids, vertex attributes, or edge attributes as defined in our schema.
- Finally, we state that our file has a header and that the separator is a comma
Using the same format, we can write a similar loading job for the rest of our data files.
For our sample of 500 patients, loading all of our data results in about 800,000 vertices and almost 2 million edges.
Sample Query
I won’t go into too much detail about GSQL queries. I don’t want to focus on the actual writing queries, but instead on the speed at which queries run— after all, this blog is meant to showcase the efficiency of graph databases. I have another blog that goes through a number of query examples if you are curious. And, as always, the TigerGraph documentation site is a great place to find more information.
Let’s run a simple query that grabs all vertices and edges immediately connected to a given patient.
create query select_All_Patient (STRING firstName, STRING lastName) for graph synthea {
/* Get all vertices and edges immediately connected to a patient
   Ex input: firstName = Antony, lastName = Hudson */

    ListAccum @@edgelist;
    Seed = {Patient.*};

    patient = select s
                FROM Seed:s -() -:t
                where s.lastName == lastName and s.firstName == firstName;

    response = select t
                from Seed:s -(:e) -:t
                where s.lastName == lastName and s.firstName == firstName
                ACCUM @@edgelist+=e;

    print patient;
    print response;
    PRINT @@edgelist;
}
This query returns a lot of information. It basically calls every touchpoint that a given patient has with the healthcare system. Normally, that would be a tough job for a database. But with our graph database, the information was retrieved within A FEW MILLISECONDS! That’s incredibly fast!
This speed applies to datasets much larger than 500 patients as well. In a sample system of 100 million patients (wow that’s a lot of data), the time taken to gather this same information is only a couple of seconds.
Querying using graphs is extremely efficient and shows a huge improvement over standard techniques used for querying healthcare data.
Further Exploration
While graph databases do serve as effective and efficient ways to hold data, their benefits extend beyond storage. We saw already how quickly queries can be performed on large datasets. But, we can also take advantage of graphs for visualizations. For example, using the same database and a slightly different query, we can easily create this 3D network graph, which only takes a few seconds to render.
Besides looking really cool, this 3D visual is extremely useful. While a 2D representation of the same information would be cluttered and impossible to read, this 3D model provides an open and clean method of viewing our large amount of interconnected data. And, while the aesthetic parts are made with HTML and JavaScript, the data, the key to the entire visualization, lies in the graph database and the query.
If you want to know how I made this visualization, check out my other blog post here!
Conclusion
Compared to normal relational databases, graphs are an excellent alternative, especially for representing highly connected data. They’re perfect for representing healthcare networks, where each patient is connected to huge amounts of data. If implemented on a large scale, this technology could greatly reduce the burden experienced by EHRs, and make storing, analyzing, and visualizing data much more efficient. Graphs are the future of medical data!
I hope you enjoyed this blog and learned something new. Let me know what you think!
Learn more about TigerGraph for Healthcare.


