Products
TigerGraph Savanna
TIGERGRAPH DB
Community Edition
AI & Graph Intelligence
Hybrid Graph + Vector Search
Graph Data Science Library
Languages and Tools
Solution Kits
GSQL Query Language
openCypher Query Language
GraphStudio
Insights
Connectors
Compare Editions
Solutions
Solutions
Solutions Overview
Increase revenue
Product Marketing
Customer 360
Entity Resolution
Recommendation Engine
Manage risk
Fraud Detection and Protection
Cybersecurity Threat Detection
Anti-Money Laundering (AML)
Risk Assessment and Monitoring
Improve operations
Supply Chain Analysis
Network Optimization
Energy Management System
By industry
Advertising, Media, Entertainment
Financial Services
Healthcare & Life Sciences
Foundational
AI & Machine Learning
Time Series Analysis
Geospatial Analysis
Developers
Download
TigerGraph DB
TigerGraph Docker Image
GSQL Client
Developers
Documentation
Developer Hub
Ecosystem
Community Forum
Resources
Blog
TigerGraph Blog
Resources
Demos
Webinars & Events
Videos & Podcasts
Benchmarks
Reports & Whitepapers
Datasheets
Glossary
Pricing
Services
Services and Support
TigerGraph University
Training & Certifications
TigerGraph Support
Documentation
Production Guidelines
Company
Company
Company Overview
Leadership
Legal Terms
Patents
Security and Compliance
Careers
Join Us
Open Positions
Customers
Ford
Intuit
Jaguar Land Rover
Xbox
JP Morgan Chase
Read more success stories
Press Room
News and Press Releases
Awards
Partners
Partner Benefits
TigerGraph Partners
Contact Us
Blog
Discover our blog
TigerGraph Welcomes Rohit Chauhan, Former Mastercard EVP of AI & Fraud, as Strategic Advisor
Discover
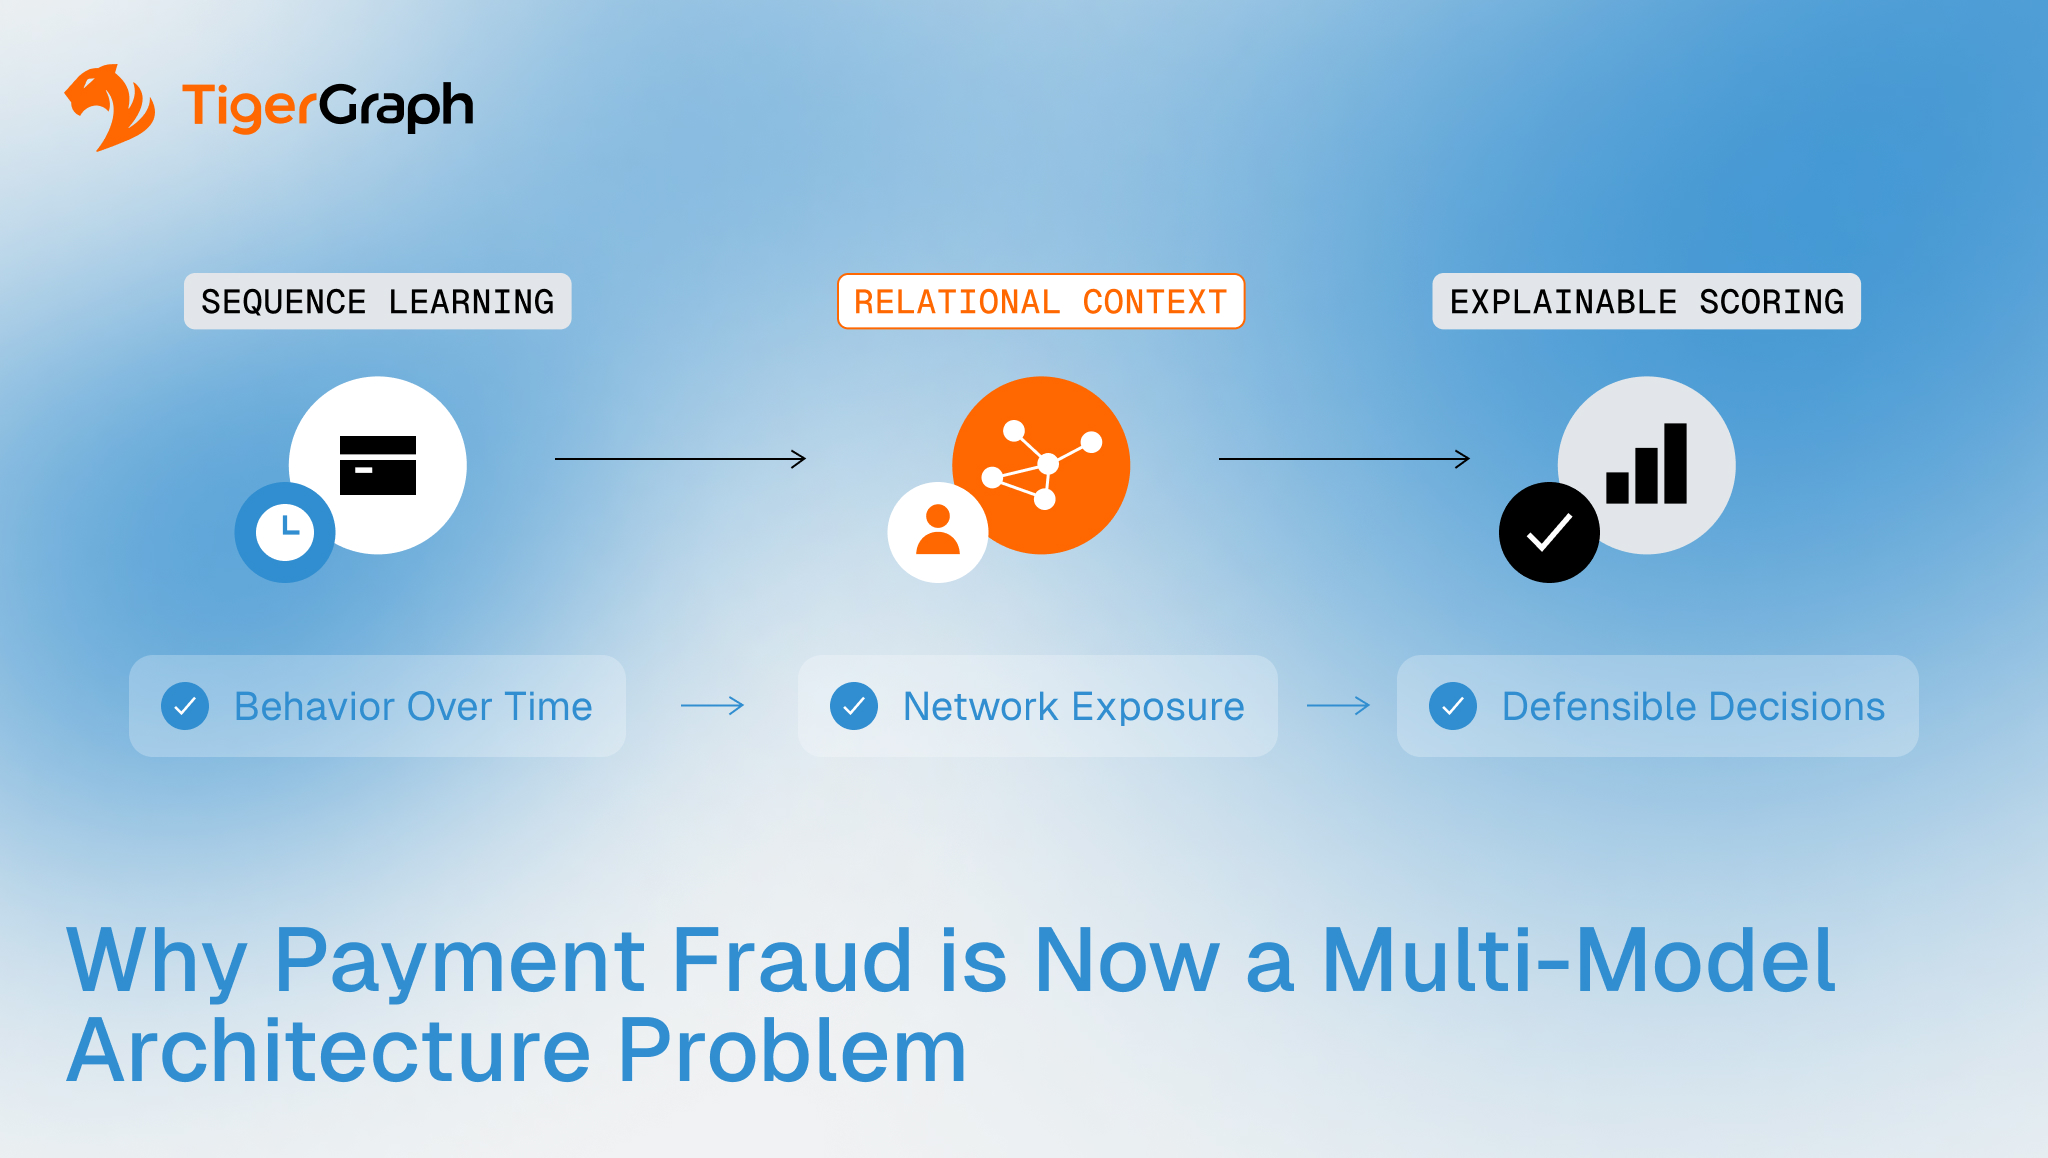
Why Payment Fraud Is Now a Multi-Model Architecture Problem
Discover
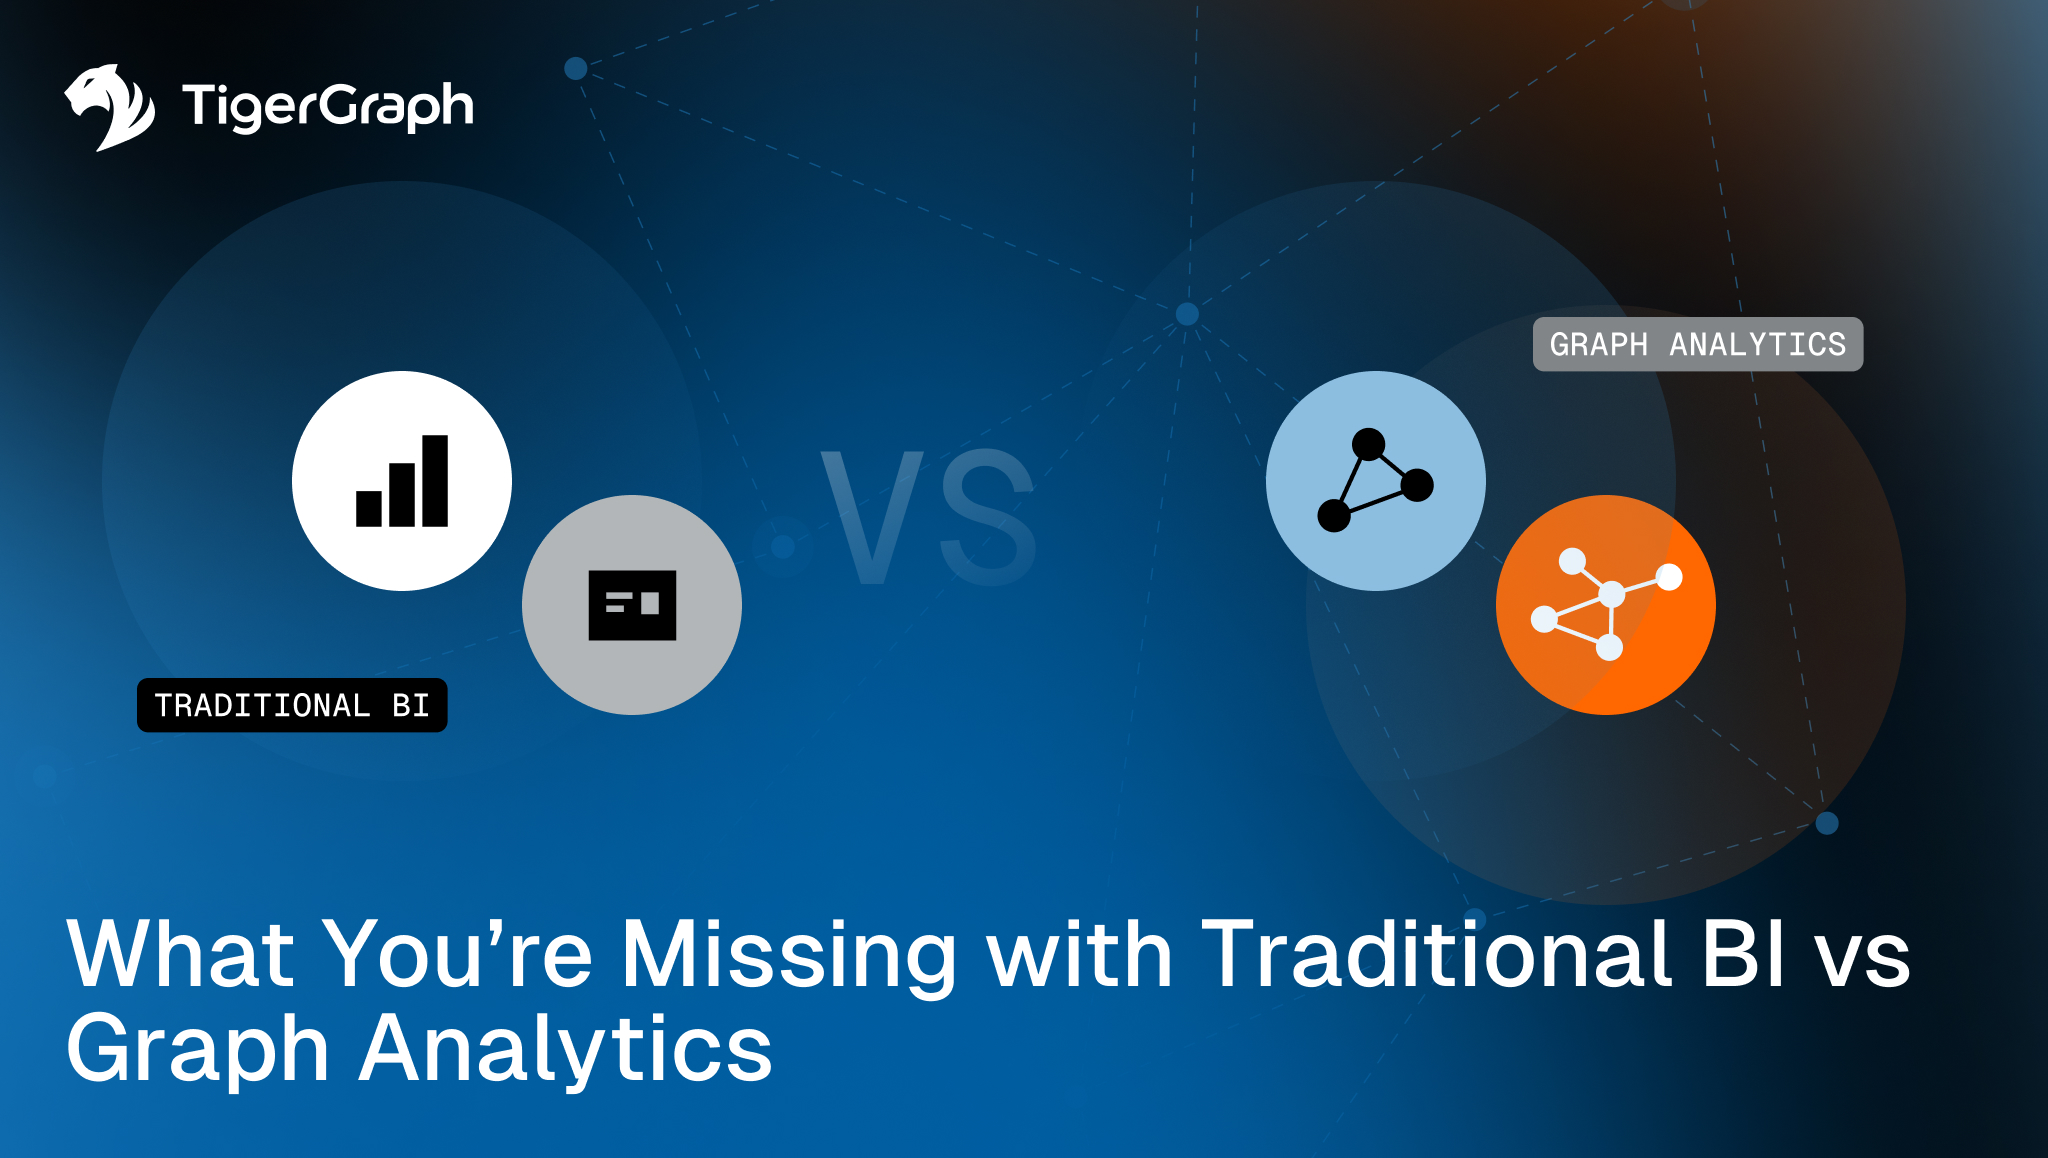
What You’re Missing with Traditional BI vs Graph Analytics
Discover
From Crunchbase to Boardroom: Graph Your Startup Strategy
Discover
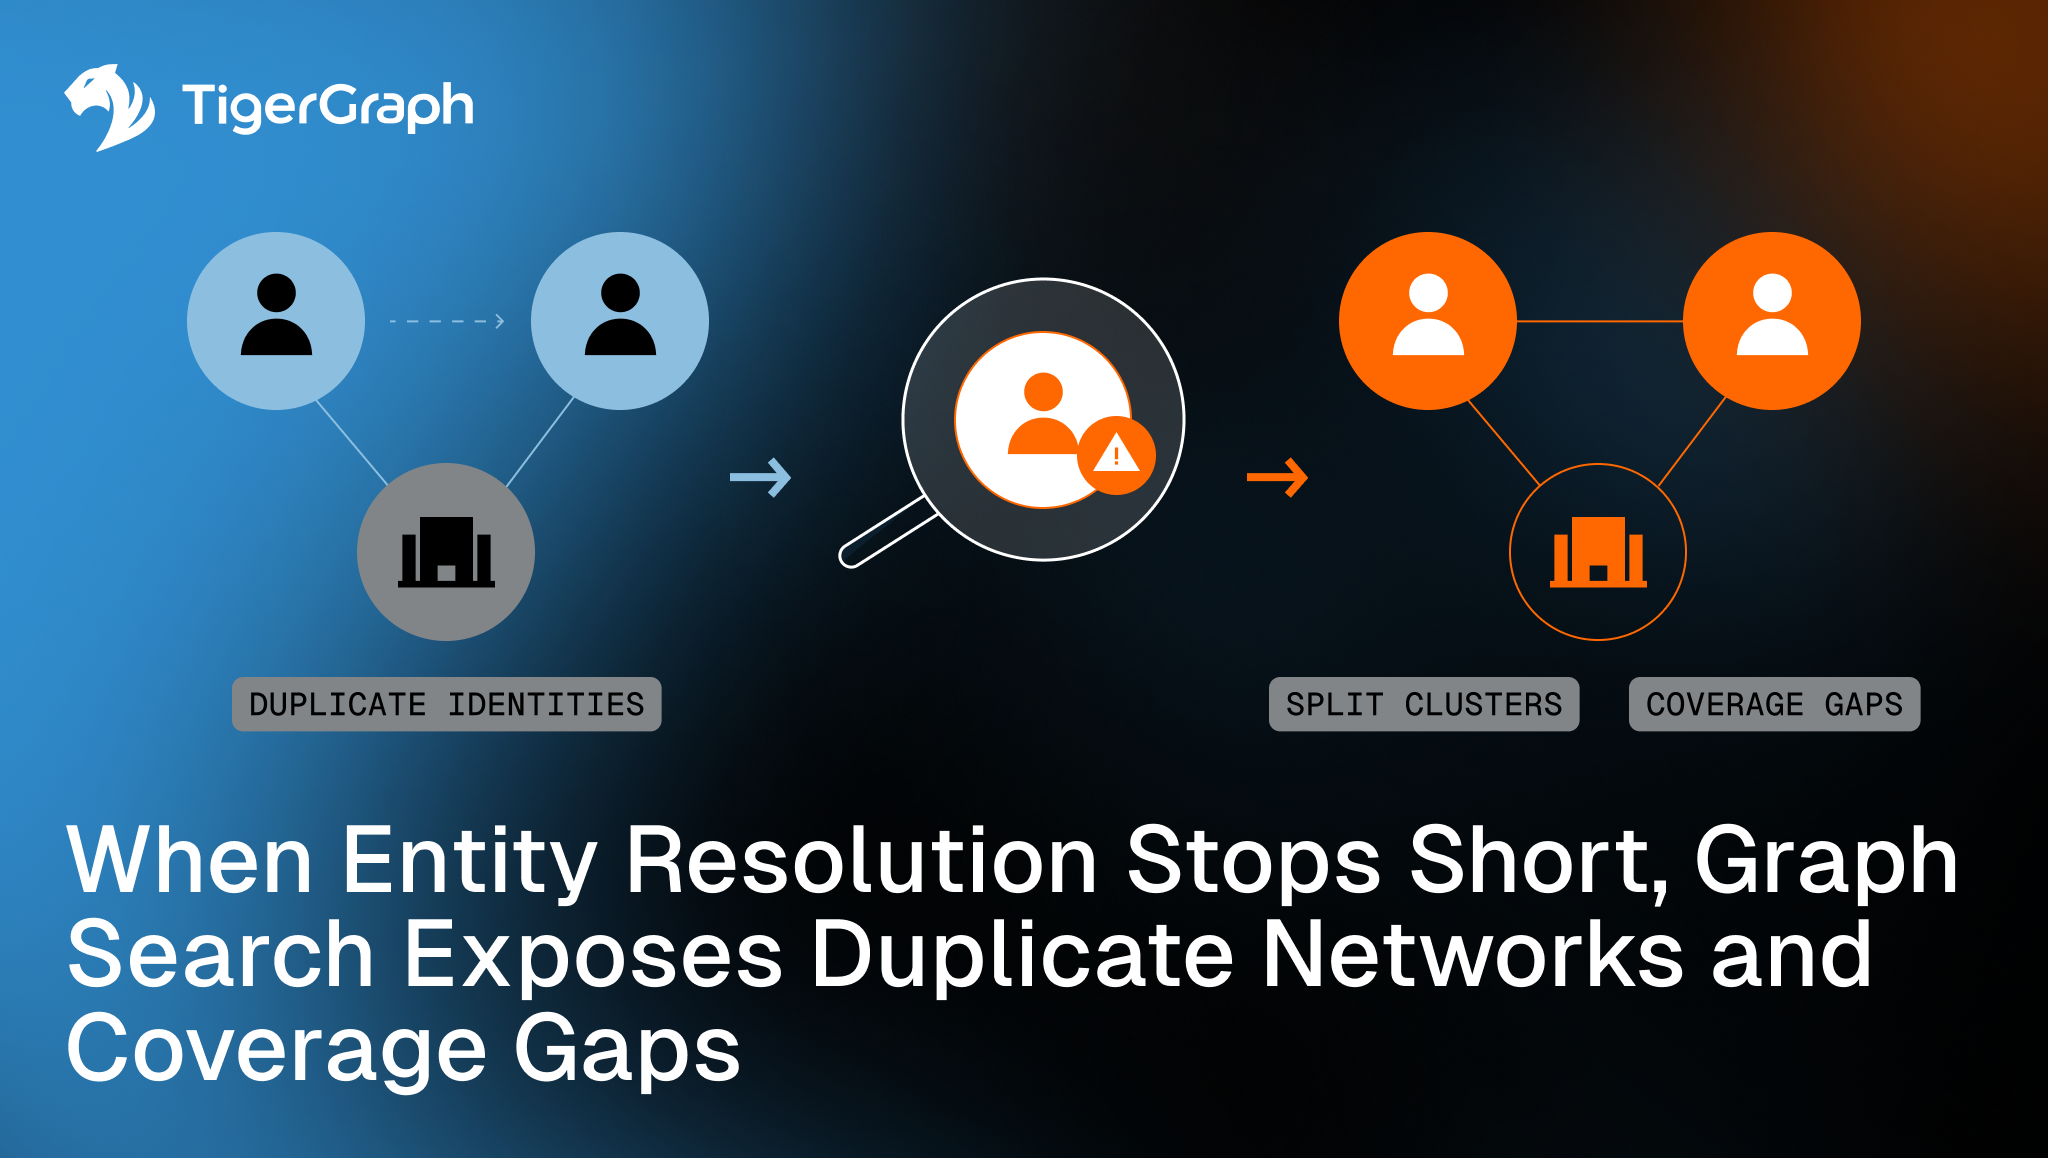
When Entity Resolution Stops Short, Graph Search Exposes Duplicate Networks and Coverage Gaps
Discover
Categories
All Categories
About TigerGraph
Cloud
Community
Customer 360
Cybersecurity
Developers
Digital Transformation, Management, & Strategy
Digital Twin
Engineers
Fraud / Anti-Money Laundering
GQL
Graph + AI
Graph AI On Demand
Graph Algorithms
GSQL
Machine Learning / AI
Retail, Manufacturing, and Supply Chain
RulesEngine
Supply Chain
TigerGraph
TigerGraph Cloud
Video
Webinars
Results
Show More