Skip to content
START FOR FREE
START FOR FREE
  • SUPPORT
  • COMMUNITY
Menu
  • SUPPORT
  • COMMUNITY
MENUMENU
  • Products
    • The World’s Fastest and Most Scalable Graph Platform

      LEARN MORE

      Watch a TigerGraph Demo

      TIGERGRAPH CLOUD

      • Overview
      • TigerGraph Cloud Suite
      • FAQ
      • Pricing

      USER TOOLS

      • GraphStudio
      • Insights
      • Application Workbenches
      • Connectors and Drivers
      • Starter Kits
      • openCypher Support

      TIGERGRAPH DB

      • Overview
      • GSQL Query Language
      • Compare Editions

      GRAPH DATA SCIENCE

      • Graph Data Science Library
      • Machine Learning Workbench
  • Solutions
    • The World’s Fastest and Most Scalable Graph Platform

      LEARN MORE

      Watch a TigerGraph Demo

      Solutions

      • Solutions Overview

      INCREASE REVENUE

      • Customer Journey/360
      • Product Marketing
      • Entity Resolution
      • Recommendation Engine

      MANAGE RISK

      • Fraud Detection
      • Anti-Money Laundering
      • Threat Detection
      • Risk Monitoring

      IMPROVE OPERATIONS

      • Supply Chain Analysis
      • Energy Management
      • Network Optimization

      By Industry

      • Advertising, Media & Entertainment
      • Financial Services
      • Healthcare & Life Sciences

      FOUNDATIONAL

      • AI & Machine Learning
      • Time Series Analysis
      • Geospatial Analysis
  • Customers
    • The World’s Fastest and Most Scalable Graph Platform

      LEARN MORE

      CUSTOMER SUCCESS STORIES

      • Ford
      • Intuit
      • JPMorgan Chase
      • READ MORE SUCCESS STORIES
      • Jaguar Land Rover
      • United Health Group
      • Xbox
  • Partners
    • The World’s Fastest and Most Scalable Graph Platform

      LEARN MORE

      PARTNER PROGRAM

      • Partner Benefits
      • TigerGraph Partners
      • Sign Up
      TigerGraph partners with organizations that offer complementary technology solutions and services.​
  • Resources
    • The World’s Fastest and Most Scalable Graph Platform

      LEARN MORE

      BLOG

      • TigerGraph Blog

      RESOURCES

      • Resource Library
      • Benchmarks
      • Demos
      • O'Reilly Graph + ML Book

      EVENTS & WEBINARS

      • Graph+AI Summit
      • Graph for All - Million Dollar Challenge
      • Events &Trade Shows
      • Webinars

      DEVELOPERS

      • Documentation
      • Ecosystem
      • Developers Hub
      • Community Forum

      SUPPORT

      • Contact Support
      • Production Guidelines

      EDUCATION

      • Training & Certifications
  • Company
    • Join the World’s Fastest and Most Scalable Graph Platform

      WE ARE HIRING

      COMPANY

      • Company Overview
      • Leadership
      • Legal Terms
      • Patents
      • Security and Compliance

      CAREERS

      • Join Us
      • Open Positions

      AWARDS

      • Awards and Recognition
      • Leader in Forrester Wave
      • Gartner Research

      PRESS RELEASE

      • Read All Press Releases
      TigerGraph Reports Exceptional Customer Growth and Product Leadership as More Market-Leading Companies Tap the Power of Graph
      March 1, 2023
      Read More »

      NEWS

      • Read All News
      The-New-Stack-Logo-square

      Multiple Vendors Make Data and Analytics Ubiquitous

      TigerGraph enhances fundamentals in latest platform update

  • START FREE
    • The World’s Fastest and Most Scalable Graph Platform

      GET STARTED

      • Request a Demo
      • CONTACT US
      • Try TigerGraph
      • START FREE
      • TRY AN ONLINE DEMO

What is a Graph Database and Why Should You Care?

  • Todd Blaschka
  • October 4, 2022
  • blog, Business, Graph Database Market, Graph Databases
  • Blog >
  • What is a Graph Database and Why Should You Care?

The world is becoming more connected every day. Where have you heard that before? 

Enterprises, data analytics companies, data scientists … we’re all finding new ways to explore connections and relationships to see what they can tell us. It could be the search for better product recommendations for e-Commerce sites, banks searching for fraud indicators before it happens, or manufacturing companies looking for ways to improve the efficiency of their supply chains.

The most important aspect of any business process is understanding the relationships of any one action or asset as they relate to each other in that process.

Graph analysis recognizes that all data represents something in the real world, and almost everything in the real world is connected in some way.  These relationships in data can tell us a lot. They can help us find new patterns and similarities (people like us – based on demographic, lifestyle, etc) and about how individuals are connected to form groups of like interests.

It might be applied to social media to enrich the customer view with patterns and relationships or well beyond commercial social analysis to detect patterns in otherwise innocuous communications that might indicate an imminent attack, market failure, or social upheaval. They can reveal what products we will likely purchase in a given scenario. Or they can predict how changes in one part of the organization or infrastructure can affect other parts. 

What Is a Graph Database?

Graphs can be used to analyze all sorts of relationships across all kinds of systems — even beyond process or beyond the confines of individual operational models. Most common business questions require an understanding of the relationships between actors or objects. Graph databases and graph analytics were created out of this need to understand relationships in data. Graph databases feature the only data model where relationships between pieces of data are pre-connected. Graph analytics offers a simple way to analyze these relationships, revealing more about entities like people, products, accounts, and locations using SQL-like queries that don’t require programming experts to build or maintain them.

According to Gartner’s Afraz Jaffri at the 2022 Graph + AI Summit, “By 2025, context-driven analytics and AI models will replace 60% of existing models built on traditional data.” This is just one of many indications that graph technology will continue to grow more central to everyday business operations.

You Use Graphs Every Day

You probably didn’t realize that, but it’s true. Every time you search the internet using Google, you are using Google’s Knowledge Graph. Google is constantly refining the way it returns results for users’ searches, but one thing remains true. Every search is ranked using a graph algorithm called PageRank.

Consider what happens every time you log in to LinkedIn. When you search and view your professional contacts, you’ll see recommended contacts and the activity of people you are either directly or indirectly connected with. These relationships are displayed as 1st, 2nd, and 3rd-degree connections. This is the result of a graph database search on LinkedIn’s Professional Network Graph indicating the number of hops from you to the contact being reviewed. Every time you see common connections or common groups with a second-degree contact, or LinkedIn recommends you connect with a professional contact, you are querying the professional network graph at LinkedIn.

Let’s not forget about your retail and e-Commerce shopping experiences. Every time you use an online store, like Amazon, Wayfair, and many others, you likely now expect these services to provide product recommendations. They are represented by suggestions like “people who bought this item also bought…” or “these items are often bought together…”. That comes from a graph analytics query!

Traditional or legacy technologies like relational or NoSQL databases can’t store and analyze the relationship data to make these features a reality. Only graph databases can.

Challenges Using Relational or NoSQL Databases for Storing and Analyzing Relationships

Comparing database types

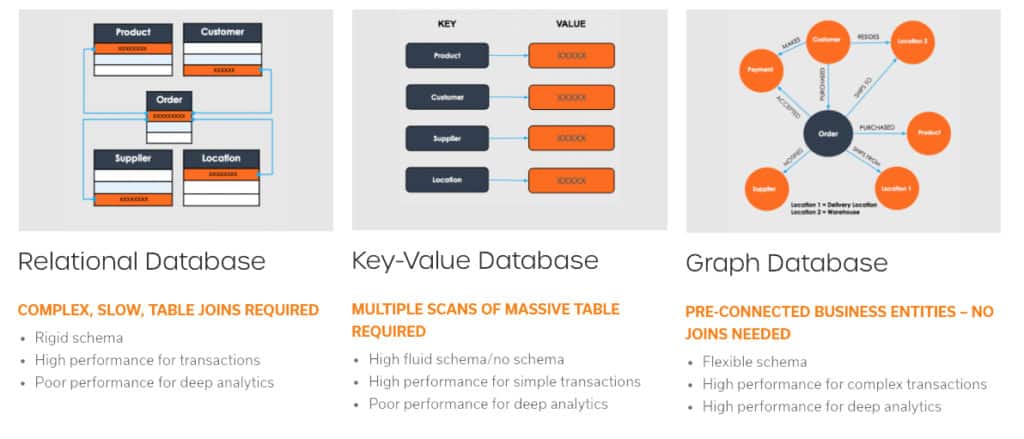
Relational databases store business facts in separate database tables. To reveal, analyze, and understand the relationships across these tables, housing information like customer details, order information, and product and payment data, you need to perform table joins in this setup. This process can take weeks and requires significant SQL programming even to build a query. 

NoSQL databases were created in an attempt to resolve this problem by storing all data in a single table for fast retrieval, not designed for analysis. 

Graph databases are purpose-built for storing and analyzing relationships among the data, as the data entities and relationships among them are pre-connected. This removes the need to perform time-consuming table joins and multiple scans across a large table. Using the power of relationships and context, graph techniques bring increasing accuracy, robustness, and versatility to predictive models and are incorporating graph analytics, graph-based features, and graph machine learning in their workflow to develop new AI applications.

With these obvious advantages in mind, you might ask yourself, “Why have enterprises not adopted graph databases faster?” It’s a valid question that requires a little history behind the development of graph technology.

Graph Database Adoption at the Enterprise Level

First-generation graph databases were built with native graph storage. They couldn’t, however, handle large data or query volumes or perform beyond three levels or connections inside the graph. They were excellent for visualizing relationships among business entities as an academic proof of concept. The scale simply wasn’t there initially for real-world enterprise production requirements. These early iterations were built on Java and were primarily designed for research and development, not the rigors of handling production use cases at scale. 

Second-generation graph databases were built on top of NoSQL storage, which allowed them to load large amounts of data. However, they still didn’t scale for queries involving three or more connections or hops. 

This limited their ability to perform deep or complex analysis. Modern graph platforms use C++ and are designed for enterprise use. The more modern approach allows for scaling compute power, mutability (meaning they support system updates), data streaming, and batching along with fast computation in the graph database, as opposed to outside the graph database and pulling the results into the database for the user to access.

Second-generation graph databases also typically didn’t support database sharding. This prevents organizations with terabytes of data from distributing the data onto multiple servers, each with a few hundred gigabytes of data. 

Further demonstrating their limitations, first and second-generation graph databases:

  • Can’t scale to multiple machines for storing big data (database sharding) and parallel query processing
  • Can’t support deep link analytics (go beyond three hops) essential for next-generation fraud detection, recommendation engine, machine learning, and AI use cases
  • Are unable to meet real-time requirements for updates and sub-second query performance on big data.

The promise inherent in graph databases and the shortcomings of previous generations led to developing a new generation in graph database and analytics technology. TigerGraph is part of that next generation, a native parallel graph database purpose-built for loading massive amounts of data (terabytes) in hours and analyzing as many as ten or more hops deep into relationships in real time. TigerGraph supports transactional as well as analytical workloads, is ACID compliant, and scales up and out with database sharding. TigerGraph’s open query language allows us to support modifications and explainable AI, delivering a platform that can be applied to multiple use cases and AI applications on connected data.

Companies around the world are investing in graph as a competitive advantage. Research in the field of graph algorithms and machine learning has shown that big improvements in predictive model quality can be made by structuring data in a graph structure that inherently captures context and relationships. 

If you’re interested in experiencing graph for yourself, give TigerGraph a try for free. Our free license is available for both our on-premises and cloud products. Once you’ve gotten started, we encourage you to join the TigerGraph Community to continue your graph journey with support from both our team of experts and other TigerGraph users.

You Might Also Like

Trillion edges benchmark: new world record beyond 100TB by TigerGraph featuring AMD based Amazon EC2 instances

Trillion edges benchmark: new world record...

March 13, 2023
Graph Databases 101: Your Top 5 Questions with Non-Technical Answers

Graph Databases 101: Your Top 5...

February 7, 2023
It’s Time to Harness the Power of Graph Technology [Infographic]

It’s Time to Harness the Power...

January 25, 2023

Introducing TigerGraph 3.0

July 1, 2020

Everything to Know to Pass your TigerGraph Certification Test

June 24, 2020

Neo4j 4.0 Fabric – A Look Behind the Curtain

February 7, 2020

TigerGraph Blog

  • Categories
    • blogs
      • About TigerGraph
      • Benchmark
      • Business
      • Community
      • Compliance
      • Customer
      • Customer 360
      • Cybersecurity
      • Developers
      • Digital Twin
      • eCommerce
      • Emerging Use Cases
      • Entity Resolution
      • Finance
      • Fraud / Anti-Money Laundering
      • GQL
      • Graph Database Market
      • Graph Databases
      • GSQL
      • Healthcare
      • Machine Learning / AI
      • Podcast
      • Supply Chain
      • TigerGraph
      • TigerGraph Cloud
    • Graph AI On Demand
      • Analysts and Research
      • Customer 360 and Entity Resolution
      • Customer Spotlight
      • Development
      • Finance, Banking, Insurance
      • Keynote
      • Session
    • Video
  • Recent Posts

    • Trillion edges benchmark: new world record beyond 100TB by TigerGraph featuring AMD based Amazon EC2 instances
    • Overview of Graph and Machine Learning with TigerGraph | Mar 8 @ 11am PST
    • Gartner Data & Analytics Summit 2023, London
    • Gartner Data and Analytics Summit, Orlando
    • Transaction Surveillance with Maximum Flow Algorithm
    TigerGraph

    Product

    SOLUTIONS

    customers

    RESOURCES

    start for free

    TIGERGRAPH DB
    • Overview
    • Features
    • GSQL Query Language
    GRAPH DATA SCIENCE
    • Graph Data Science Library
    • Machine Learning Workbench
    TIGERGRAPH CLOUD
    • Overview
    • Cloud Starter Kits
    • Login
    • FAQ
    • Pricing
    • Cloud Marketplaces
    USEr TOOLS
    • GraphStudio
    • TigerGraph Insights
    • Application Workbenches
    • Connectors and Drivers
    • Starter Kits
    • openCypher Support
    SOLUTIONS
    • Why Graph?
    industry
    • Advertising, Media & Entertainment
    • Financial Services
    • Healthcare & Life Sciences
    use cases
    • Benefits
    • Product & Service Marketing
    • Entity Resolution
    • Customer 360/MDM
    • Recommendation Engine
    • Anti-Money Laundering
    • Cybersecurity Threat Detection
    • Fraud Detection
    • Risk Assessment & Monitoring
    • Energy Management
    • Network & IT Management
    • Supply Chain Analysis
    • AI & Machine Learning
    • Geospatial Analysis
    • Time Series Analysis
    success stories
    • Customer Success Stories

    Partners

    Partner program
    • Partner Benefits
    • TigerGraph Partners
    • Sign Up
    LIBRARY
    • Resources
    • Benchmark
    • Webinars
    Events
    • Trade Shows
    • Graph + AI Summit
    • Million Dollar Challenge
    EDUCATION
    • Training & Certifications
    Blog
    • TigerGraph Blog
    DEVELOPERS
    • Developers Hub
    • Community Forum
    • Documentation
    • Ecosystem

    COMPANY

    Company
    • Overview
    • Careers
    • News
    • Press Release
    • Awards
    • Legal
    • Patents
    • Security and Compliance
    • Contact
    Get Started
    • Start Free
    • Compare Editions
    • Online Demo - Test Drive
    • Request a Demo

    Product

    • Overview
    • TigerGraph 3.0
    • TIGERGRAPH DB
    • TIGERGRAPH CLOUD
    • GRAPHSTUDIO
    • TRY NOW

    customers

    • success stories

    RESOURCES

    • LIBRARY
    • Events
    • EDUCATION
    • BLOG
    • DEVELOPERS

    SOLUTIONS

    • SOLUTIONS
    • use cases
    • industry

    Partners

    • partner program

    company

    • Overview
    • news
    • Press Release
    • Awards

    start for free

    • Request Demo
    • take a test drive
    • SUPPORT
    • COMMUNITY
    • CONTACT
    • Copyright © 2023 TigerGraph
    • Privacy Policy
    • Linkedin
    • Facebook
    • Twitter

    Copyright © 2020 TigerGraph | Privacy Policy

    Copyright © 2020 TigerGraph Privacy Policy

    • SUPPORT
    • COMMUNITY
    • COMPANY
    • CONTACT
    • Linkedin
    • Facebook
    • Twitter

    Copyright © 2020 TigerGraph

    Privacy Policy

    • Products
    • Solutions
    • Customers
    • Partners
    • Resources
    • Company
    • START FREE
    START FOR FREE
    START FOR FREE
    TigerGraph
    PRODUCT
    PRODUCT
    • Overview
    • GraphStudio UI
    • Graph Data Science Library
    TIGERGRAPH DB
    • Overview
    • Features
    • GSQL Query Language
    TIGERGRAPH CLOUD
    • Overview
    • Cloud Starter Kits
    TRY TIGERGRAPH
    • Get Started for Free
    • Compare Editions
    SOLUTIONS
    SOLUTIONS
    • Why Graph?
    use cases
    • Benefits
    • Product & Service Marketing
    • Entity Resolution
    • Customer Journey/360
    • Recommendation Engine
    • Anti-Money Laundering (AML)
    • Cybersecurity Threat Detection
    • Fraud Detection
    • Risk Assessment & Monitoring
    • Energy Management
    • Network Resources Optimization
    • Supply Chain Analysis
    • AI & Machine Learning
    • Geospatial Analysis
    • Time Series Analysis
    industry
    • Advertising, Media & Entertainment
    • Financial Services
    • Healthcare & Life Sciences
    CUSTOMERS
    read all success stories


    PARTNERS
    Partner program
    • Partner Benefits
    • TigerGraph Partners
    • Sign Up
    RESOURCES
    LIBRARY
    • Resource Library
    • Benchmark
    • Webinars
    Events
    • Trade Shows
    • Graph + AI Summit
    • Graph for All - Million Dollar Challenge
    EDUCATION
    • TigerGraph Academy
    • Certification
    Blog
    • TigerGraph Blog
    DEVELOPERS
    • Developers Hub
    • Community Forum
    • Documentation
    • Ecosystem
    COMPANY
    COMPANY
    • Overview
    • Leadership
    • Careers  
    NEWS
    PRESS RELEASE
    AWARDS
    START FREE
    Start Free
    • Request a Demo
    • SUPPORT
    • COMMUNITY
    • CONTACT
    Dr. Jay Yu

    Dr. Jay Yu | VP of Product and Innovation

    Dr. Jay Yu is the VP of Product and Innovation at TigerGraph, responsible for driving product strategy and roadmap, as well as fostering innovation in graph database engine and graph solutions. He is a proven hands-on full-stack innovator, strategic thinker, leader, and evangelist for new technology and product, with 25+ years of industry experience ranging from highly scalable distributed database engine company (Teradata), B2B e-commerce services startup, to consumer-facing financial applications company (Intuit). He received his PhD from the University of Wisconsin - Madison, where he specialized in large scale parallel database systems

    Todd Blaschka | COO

    Todd Blaschka is a veteran in the enterprise software industry. He is passionate about creating entirely new segments in data, analytics and AI, with the distinction of establishing graph analytics as a Gartner Top 10 Data & Analytics trend two years in a row. By fervently focusing on critical industry and customer challenges, the companies under Todd's leadership have delivered significant quantifiable results to the largest brands in the world through channel and solution sales approach. Prior to TigerGraph, Todd led go to market and customer experience functions at Clustrix (acquired by MariaDB), Dataguise and IBM.