Skip to content
START FOR FREE
START FOR FREE
  • SUPPORT
  • COMMUNITY
Menu
  • SUPPORT
  • COMMUNITY
MENUMENU
  • Products
    • The World’s Fastest and Most Scalable Graph Platform

      LEARN MORE

      Watch a TigerGraph Demo

      TIGERGRAPH CLOUD

      • Overview
      • TigerGraph Cloud Suite
      • FAQ
      • Pricing

      USER TOOLS

      • GraphStudio
      • Insights
      • Application Workbenches
      • Connectors and Drivers
      • Starter Kits
      • openCypher Support

      TIGERGRAPH DB

      • Overview
      • GSQL Query Language
      • Compare Editions

      GRAPH DATA SCIENCE

      • Graph Data Science Library
      • Machine Learning Workbench
  • Solutions
    • The World’s Fastest and Most Scalable Graph Platform

      LEARN MORE

      Watch a TigerGraph Demo

      Solutions

      • Solutions Overview

      INCREASE REVENUE

      • Customer Journey/360
      • Product Marketing
      • Entity Resolution
      • Recommendation Engine

      MANAGE RISK

      • Fraud Detection
      • Anti-Money Laundering
      • Threat Detection
      • Risk Monitoring

      IMPROVE OPERATIONS

      • Supply Chain Analysis
      • Energy Management
      • Network Optimization

      By Industry

      • Advertising, Media & Entertainment
      • Financial Services
      • Healthcare & Life Sciences

      FOUNDATIONAL

      • AI & Machine Learning
      • Time Series Analysis
      • Geospatial Analysis
  • Customers
    • The World’s Fastest and Most Scalable Graph Platform

      LEARN MORE

      CUSTOMER SUCCESS STORIES

      • Ford
      • Intuit
      • JPMorgan Chase
      • READ MORE SUCCESS STORIES
      • Jaguar Land Rover
      • United Health Group
      • Xbox
  • Partners
    • The World’s Fastest and Most Scalable Graph Platform

      LEARN MORE

      PARTNER PROGRAM

      • Partner Benefits
      • TigerGraph Partners
      • Sign Up
      TigerGraph partners with organizations that offer complementary technology solutions and services.​
  • Resources
    • The World’s Fastest and Most Scalable Graph Platform

      LEARN MORE

      BLOG

      • TigerGraph Blog

      RESOURCES

      • Resource Library
      • Benchmarks
      • Demos
      • O'Reilly Graph + ML Book

      EVENTS & WEBINARS

      • Graph+AI Summit
      • Graph for All - Million Dollar Challenge
      • Events &Trade Shows
      • Webinars

      DEVELOPERS

      • Documentation
      • Ecosystem
      • Developers Hub
      • Community Forum

      SUPPORT

      • Contact Support
      • Production Guidelines

      EDUCATION

      • Training & Certifications
  • Company
    • Join the World’s Fastest and Most Scalable Graph Platform

      WE ARE HIRING

      COMPANY

      • Company Overview
      • Leadership
      • Legal Terms
      • Patents
      • Security and Compliance

      CAREERS

      • Join Us
      • Open Positions

      AWARDS

      • Awards and Recognition
      • Leader in Forrester Wave
      • Gartner Research

      PRESS RELEASE

      • Read All Press Releases
      TigerGraph Reports Exceptional Customer Growth and Product Leadership as More Market-Leading Companies Tap the Power of Graph
      March 1, 2023
      Read More »

      NEWS

      • Read All News
      The-New-Stack-Logo-square

      Multiple Vendors Make Data and Analytics Ubiquitous

      TigerGraph enhances fundamentals in latest platform update

  • START FREE
    • The World’s Fastest and Most Scalable Graph Platform

      GET STARTED

      • Request a Demo
      • CONTACT US
      • Try TigerGraph
      • START FREE
      • TRY AN ONLINE DEMO

Machine Learning and Deep Link Graph Analytics: A Powerful Combination

  • Emily McAuliffe
  • April 14, 2019
  • blog, Business, Fraud / Anti-Money Laundering, Machine Learning / AI
  • Blog >
  • Machine Learning and Deep Link Graph Analytics: A Powerful Combination

Originally Posted on KDNuggets.

Machine learning (ML) – an aspect of artificial intelligence (AI) that allows software to accurately identify patterns and predict outcomes – has become a hot industry topic. With ever-increasing advances in data analysis, storage, and computing power in the last few years, machine learning has been playing an increasingly important role in enterprise applications such as fraud prevention, personalized recommendation, predictive analytics, and so on.

Applying graph database capabilities to ML and AI apps is relatively new, however. That’s surprising in light of the fact that Google’s Knowledge Graph, which first popularized the concept of finding relationships within data to yield more relevant and precise information, dates back to 2012. Also, it’s a natural fit: Graphs are ideal for storing, connecting, and making inferences from complex data.

The main reason that graphs have not played an important role in ML is that legacy graph databases cannot deliver what is really needed for machine learning: deep link graph analytics for large datasets.

Let’s take a deeper dive into how graphs can help machine learning and how they are related to deep-link graph analytics for Big Data.

Unsupervised Native Graph-Based Machine Learning Algorithms

First, graph analytics directly offers a unique set of unsupervised machine learning methods. A host of graph algorithms — community detection, PageRank, label propagation, betweenness centrality, closeness centrality, and similarity of neighborhoods — identify meaningful graph-oriented patterns which have wide applications. These include identifying fraud patterns, finding user groups, computing influential users or communities, and reporting weaknesses or bottlenecks in operations or a supply chain.

A common quality that these native graph algorithms share is that they all need to do deep link graph analytics — traversing several hops or levels of connection within a graph to gather data and analyze it. Such traversal, especially for full-graph analyses like community detection, requires powerful graph computational capability. Only a native parallel graph database can provide that.

Graph Features for Training Supervised Machine Learning Algorithms

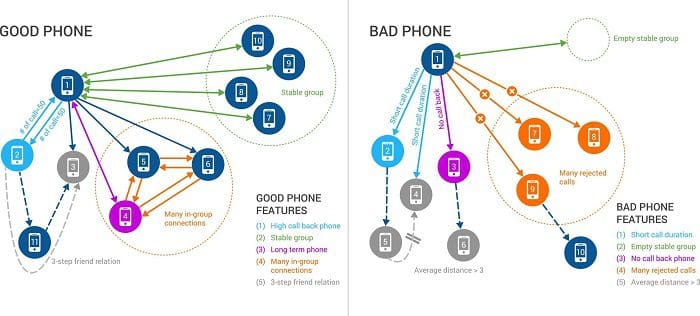
A second way that deep-link graph analytics helps machine learning is by enriching the set of data features available for supervised machine learning. Consider the example of China Mobile, the world’s largest mobile service provider with more than 900 million subscribers. China Mobile’s network has over 2 billion voice calls every week, and their main challenge was finding phone-based fraudsters who used pre-paid SIM cards with little or no details about the subscriber. So it was hard to distinguish the good phone belonging to a regular subscriber from the bad phone belonging to a fraudster. Simple features such as the duration of the call or the percentage of rejected calls resulted in a lot of false positives.

China Mobile leveraged graph-based machine learning features such as stable group and in-group connections to improve the accuracy of the machine learning for fraud detection. A good phone also regularly calls a set of other phones – say, every week or month – and this group of phones is fairly stable over a period of time (“stable group”).

Another feature indicating good phone behavior is when a phone calls another that has been in the network for many months or years and receives calls back. We also see a high number of calls between the good phone, the long-term phone contact and other phones within a network calling both these numbers frequently. This indicates many “in-group connections” for the good phone. China Mobile has transformed its fraud detection process by generating 118 graph-based features for each phone, feeding tens of billions in new training data records to their machine learning solution.

Good Phone Bad Phone

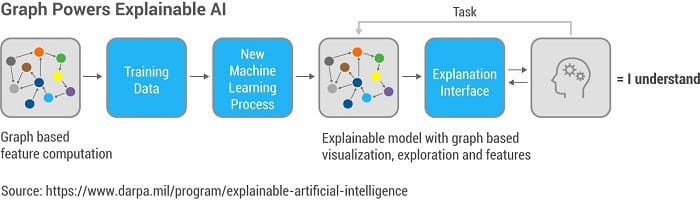
Explainable Machine Learning/AI Models

Explainable models are becoming a much-discussed topic as machine learning adoption grows. A common criticism of methods like neural networks and their offspring, deep learning networks, is that the predictive models they produce often do not provide any insight into the causal factors.  They cannot give a simple answer to why they predicted a result. Explainable models, on the other hand, tend to highlight the key variables that lead to a decision.  A traditional example is a decision tree. Consider a decision tree to rate your risk of cancer: Do you smoke regularly? If yes, you have an above-average risk. If no, ask the next question… Note that a decision tree is a specialized graph.

Similarly, when graph algorithms or graph features are used as part of an AI model, the natural semantics of graph relationships, such as “Customer –(bought)–> Product” lend themselves easily to interpretation.

They are many benefits of explainable AI models. Consumers have come to expect personalized recommendations, for example. If the recommendation comes with some explanation or evidence, the user is more likely to act on it. Graph analytics is well-suited to compute and show the evidence behind these personalized recommendations and explain with graph visualization as needed. For example, graph analytics may show that a percentage of your friends at two or three degrees of separation like this product or service, or that a percentage of other users who have similar interests to you like it, or that the product is similar to your previous purchases.

Graph-based machine learning and analytics is helpful not only to consumers, but also to enterprise users. Take fraud detection, for example. Many enterprises employ large teams of trained investigators to determine whether a transaction is likely to be fraudulent. Graphs excel at combining multiple data sources to connect the dots and allow investigators to see, visually and interactively, how the transaction in question is connected to those previously marked as fraudulent. This is more helpful than, say, just receiving a vague 0.7 fraud score from some machine learning models.

Another example: real-time phone scamming prevention. Each day, hundreds of millions of phone calls are made, but only a tiny fraction of these are malicious scams. Graph technology can quickly explore relationships among callers, phone numbers, and recipients, and be combined with ML to develop trained models to detect which are bogus.

What’s more, explainable ML becomes a requirement when a regulatory agency or other auditing party is involved. Banks are required to have high-quality methods to detect possible money laundering.  More and more, banks are using machine learning to improve their detection accuracy, but at the same time, they must be able to show an auditor how and why their system is effective. An ML model that uses graph-based features provides the transparency that is needed.

Graph Powers Explainable AI

Native Parallel Graph Databases

Machine learning has always been computationally demanding, and graph-based machine learning is no exception. With every hop, or level of connected data, the size of data in the search expands exponentially, requiring massively parallel computation to traverse the data. This is computationally too expensive for key-value databases that require too many separate lookups or RDBMS that struggle with too many slow joins. Even a standard graph database may not be able to handle deep link analytics on large graphs.  A native graph database featuring massively parallel and distributed processing is needed.

In order to compute and explain the reasons behind personalized recommendations and fraud detection, the graph database needs a powerful query language that can not only traverse the connections in the graph but also support computation such as filtering and aggregation and complex data structures to remember the evidence.

Deep-link graph analytics is powering the next advance in machine learning, through unsupervised learning of graph patterns, feature enrichment for supervised learning, and providing explainable models and results. Combined with AI and ML, it’s a potent combination that will serve enterprises well for years to come.

You Might Also Like

Trillion edges benchmark: new world record beyond 100TB by TigerGraph featuring AMD based Amazon EC2 instances

Trillion edges benchmark: new world record...

March 13, 2023
Graph Databases 101: Your Top 5 Questions with Non-Technical Answers

Graph Databases 101: Your Top 5...

February 7, 2023
It’s Time to Harness the Power of Graph Technology [Infographic]

It’s Time to Harness the Power...

January 25, 2023

Introducing TigerGraph 3.0

July 1, 2020

Everything to Know to Pass your TigerGraph Certification Test

June 24, 2020

Neo4j 4.0 Fabric – A Look Behind the Curtain

February 7, 2020

TigerGraph Blog

  • Categories
    • blogs
      • About TigerGraph
      • Benchmark
      • Business
      • Community
      • Compliance
      • Customer
      • Customer 360
      • Cybersecurity
      • Developers
      • Digital Twin
      • eCommerce
      • Emerging Use Cases
      • Entity Resolution
      • Finance
      • Fraud / Anti-Money Laundering
      • GQL
      • Graph Database Market
      • Graph Databases
      • GSQL
      • Healthcare
      • Machine Learning / AI
      • Podcast
      • Supply Chain
      • TigerGraph
      • TigerGraph Cloud
    • Graph AI On Demand
      • Analysts and Research
      • Customer 360 and Entity Resolution
      • Customer Spotlight
      • Development
      • Finance, Banking, Insurance
      • Keynote
      • Session
    • Video
  • Recent Posts

    • Trillion edges benchmark: new world record beyond 100TB by TigerGraph featuring AMD based Amazon EC2 instances
    • Overview of Graph and Machine Learning with TigerGraph | Mar 8 @ 11am PST
    • Gartner Data & Analytics Summit 2023, London
    • Gartner Data and Analytics Summit, Orlando
    • Transaction Surveillance with Maximum Flow Algorithm
    TigerGraph

    Product

    SOLUTIONS

    customers

    RESOURCES

    start for free

    TIGERGRAPH DB
    • Overview
    • Features
    • GSQL Query Language
    GRAPH DATA SCIENCE
    • Graph Data Science Library
    • Machine Learning Workbench
    TIGERGRAPH CLOUD
    • Overview
    • Cloud Starter Kits
    • Login
    • FAQ
    • Pricing
    • Cloud Marketplaces
    USEr TOOLS
    • GraphStudio
    • TigerGraph Insights
    • Application Workbenches
    • Connectors and Drivers
    • Starter Kits
    • openCypher Support
    SOLUTIONS
    • Why Graph?
    industry
    • Advertising, Media & Entertainment
    • Financial Services
    • Healthcare & Life Sciences
    use cases
    • Benefits
    • Product & Service Marketing
    • Entity Resolution
    • Customer 360/MDM
    • Recommendation Engine
    • Anti-Money Laundering
    • Cybersecurity Threat Detection
    • Fraud Detection
    • Risk Assessment & Monitoring
    • Energy Management
    • Network & IT Management
    • Supply Chain Analysis
    • AI & Machine Learning
    • Geospatial Analysis
    • Time Series Analysis
    success stories
    • Customer Success Stories

    Partners

    Partner program
    • Partner Benefits
    • TigerGraph Partners
    • Sign Up
    LIBRARY
    • Resources
    • Benchmark
    • Webinars
    Events
    • Trade Shows
    • Graph + AI Summit
    • Million Dollar Challenge
    EDUCATION
    • Training & Certifications
    Blog
    • TigerGraph Blog
    DEVELOPERS
    • Developers Hub
    • Community Forum
    • Documentation
    • Ecosystem

    COMPANY

    Company
    • Overview
    • Careers
    • News
    • Press Release
    • Awards
    • Legal
    • Patents
    • Security and Compliance
    • Contact
    Get Started
    • Start Free
    • Compare Editions
    • Online Demo - Test Drive
    • Request a Demo

    Product

    • Overview
    • TigerGraph 3.0
    • TIGERGRAPH DB
    • TIGERGRAPH CLOUD
    • GRAPHSTUDIO
    • TRY NOW

    customers

    • success stories

    RESOURCES

    • LIBRARY
    • Events
    • EDUCATION
    • BLOG
    • DEVELOPERS

    SOLUTIONS

    • SOLUTIONS
    • use cases
    • industry

    Partners

    • partner program

    company

    • Overview
    • news
    • Press Release
    • Awards

    start for free

    • Request Demo
    • take a test drive
    • SUPPORT
    • COMMUNITY
    • CONTACT
    • Copyright © 2023 TigerGraph
    • Privacy Policy
    • Linkedin
    • Facebook
    • Twitter

    Copyright © 2020 TigerGraph | Privacy Policy

    Copyright © 2020 TigerGraph Privacy Policy

    • SUPPORT
    • COMMUNITY
    • COMPANY
    • CONTACT
    • Linkedin
    • Facebook
    • Twitter

    Copyright © 2020 TigerGraph

    Privacy Policy

    • Products
    • Solutions
    • Customers
    • Partners
    • Resources
    • Company
    • START FREE
    START FOR FREE
    START FOR FREE
    TigerGraph
    PRODUCT
    PRODUCT
    • Overview
    • GraphStudio UI
    • Graph Data Science Library
    TIGERGRAPH DB
    • Overview
    • Features
    • GSQL Query Language
    TIGERGRAPH CLOUD
    • Overview
    • Cloud Starter Kits
    TRY TIGERGRAPH
    • Get Started for Free
    • Compare Editions
    SOLUTIONS
    SOLUTIONS
    • Why Graph?
    use cases
    • Benefits
    • Product & Service Marketing
    • Entity Resolution
    • Customer Journey/360
    • Recommendation Engine
    • Anti-Money Laundering (AML)
    • Cybersecurity Threat Detection
    • Fraud Detection
    • Risk Assessment & Monitoring
    • Energy Management
    • Network Resources Optimization
    • Supply Chain Analysis
    • AI & Machine Learning
    • Geospatial Analysis
    • Time Series Analysis
    industry
    • Advertising, Media & Entertainment
    • Financial Services
    • Healthcare & Life Sciences
    CUSTOMERS
    read all success stories


    PARTNERS
    Partner program
    • Partner Benefits
    • TigerGraph Partners
    • Sign Up
    RESOURCES
    LIBRARY
    • Resource Library
    • Benchmark
    • Webinars
    Events
    • Trade Shows
    • Graph + AI Summit
    • Graph for All - Million Dollar Challenge
    EDUCATION
    • TigerGraph Academy
    • Certification
    Blog
    • TigerGraph Blog
    DEVELOPERS
    • Developers Hub
    • Community Forum
    • Documentation
    • Ecosystem
    COMPANY
    COMPANY
    • Overview
    • Leadership
    • Careers  
    NEWS
    PRESS RELEASE
    AWARDS
    START FREE
    Start Free
    • Request a Demo
    • SUPPORT
    • COMMUNITY
    • CONTACT
    Dr. Jay Yu

    Dr. Jay Yu | VP of Product and Innovation

    Dr. Jay Yu is the VP of Product and Innovation at TigerGraph, responsible for driving product strategy and roadmap, as well as fostering innovation in graph database engine and graph solutions. He is a proven hands-on full-stack innovator, strategic thinker, leader, and evangelist for new technology and product, with 25+ years of industry experience ranging from highly scalable distributed database engine company (Teradata), B2B e-commerce services startup, to consumer-facing financial applications company (Intuit). He received his PhD from the University of Wisconsin - Madison, where he specialized in large scale parallel database systems

    Todd Blaschka | COO

    Todd Blaschka is a veteran in the enterprise software industry. He is passionate about creating entirely new segments in data, analytics and AI, with the distinction of establishing graph analytics as a Gartner Top 10 Data & Analytics trend two years in a row. By fervently focusing on critical industry and customer challenges, the companies under Todd's leadership have delivered significant quantifiable results to the largest brands in the world through channel and solution sales approach. Prior to TigerGraph, Todd led go to market and customer experience functions at Clustrix (acquired by MariaDB), Dataguise and IBM.