Skip to content
START FOR FREE
START FOR FREE
  • SUPPORT
  • COMMUNITY
Menu
  • SUPPORT
  • COMMUNITY
MENUMENU
  • Products
    • The World’s Fastest and Most Scalable Graph Platform

      LEARN MORE

      Watch a TigerGraph Demo

      TIGERGRAPH CLOUD

      • Overview
      • TigerGraph Cloud Suite
      • FAQ
      • Pricing

      USER TOOLS

      • GraphStudio
      • Insights
      • Application Workbenches
      • Connectors and Drivers
      • Starter Kits
      • openCypher Support

      TIGERGRAPH DB

      • Overview
      • GSQL Query Language
      • Compare Editions

      GRAPH DATA SCIENCE

      • Graph Data Science Library
      • Machine Learning Workbench
  • Solutions
    • The World’s Fastest and Most Scalable Graph Platform

      LEARN MORE

      Watch a TigerGraph Demo

      Solutions

      • Solutions Overview

      INCREASE REVENUE

      • Customer Journey/360
      • Product Marketing
      • Entity Resolution
      • Recommendation Engine

      MANAGE RISK

      • Fraud Detection
      • Anti-Money Laundering
      • Threat Detection
      • Risk Monitoring

      IMPROVE OPERATIONS

      • Supply Chain Analysis
      • Energy Management
      • Network Optimization

      By Industry

      • Advertising, Media & Entertainment
      • Financial Services
      • Healthcare & Life Sciences

      FOUNDATIONAL

      • AI & Machine Learning
      • Time Series Analysis
      • Geospatial Analysis
  • Customers
    • The World’s Fastest and Most Scalable Graph Platform

      LEARN MORE

      CUSTOMER SUCCESS STORIES

      • Ford
      • Intuit
      • JPMorgan Chase
      • READ MORE SUCCESS STORIES
      • Jaguar Land Rover
      • United Health Group
      • Xbox
  • Partners
    • The World’s Fastest and Most Scalable Graph Platform

      LEARN MORE

      PARTNER PROGRAM

      • Partner Benefits
      • TigerGraph Partners
      • Sign Up
      TigerGraph partners with organizations that offer complementary technology solutions and services.​
  • Resources
    • The World’s Fastest and Most Scalable Graph Platform

      LEARN MORE

      BLOG

      • TigerGraph Blog

      RESOURCES

      • Resource Library
      • Benchmarks
      • Demos
      • O'Reilly Graph + ML Book

      EVENTS & WEBINARS

      • Graph+AI Summit
      • Graph for All - Million Dollar Challenge
      • Events &Trade Shows
      • Webinars

      DEVELOPERS

      • Documentation
      • Ecosystem
      • Developers Hub
      • Community Forum

      SUPPORT

      • Contact Support
      • Production Guidelines

      EDUCATION

      • Training & Certifications
  • Company
    • Join the World’s Fastest and Most Scalable Graph Platform

      WE ARE HIRING

      COMPANY

      • Company Overview
      • Leadership
      • Legal Terms
      • Patents
      • Security and Compliance

      CAREERS

      • Join Us
      • Open Positions

      AWARDS

      • Awards and Recognition
      • Leader in Forrester Wave
      • Gartner Research

      PRESS RELEASE

      • Read All Press Releases
      TigerGraph Recognized in 2022 Gartner® Critical Capabilities for Cloud Database Management Systems for Analytical Use Cases
      January 12, 2023
      Read More »

      NEWS

      • Read All News

      A Shock to the System: ShockNet Predicts How Economic Shocks Could Affect the World Economy

      TigerGraph Recognized for the First Time in the 2022 Gartner® Magic Quadrant™ for Cloud Database Management Systems

  • START FREE
    • The World’s Fastest and Most Scalable Graph Platform

      GET STARTED

      • Request a Demo
      • CONTACT US
      • Try TigerGraph
      • START FREE
      • TRY AN ONLINE DEMO

Just a Key-Value Problem? How Graph Reduces Memory Consumption, Accelerates Performance and Overcomes Problems with Key-Value Databases

  • Yu Xu
  • September 12, 2019
  • Developers
  • Blog >
  • Just a Key-Value Problem? How Graph Reduces Memory Consumption, Accelerates Performance and Overcomes Problems with Key-Value Databases

Key-value databases have long been used for a variety of applications to provide pre-computed results in real-time. There is, however, an increasing shift towards using Graph technology for real-time applications that illustrates how this game-changing approach is not only ideal for complex datasets and complex queries, but also for simple real-time applications. Graph technology reduces memory consumption, improves app latency, simplifies app development and more.  

Here is an example use case in personalized e-commerce recommendations. The business precomputes a list of products to be recommended for each end user using various recommendation models. For example here are three possible models: 

Model 1 (based on gender and age)

Model 2 (based on each user’s past behavior)

Model 3 (based on other users who have similar purchase patterns)
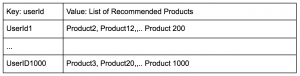
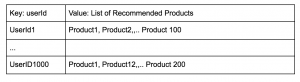
Key-Value Approach 

Each recommended product list for each user is stored as a key-value pair in a key-value database. Key=UserId, Value=List of ProductIds to be recommended. To recommend products to a user, the e-commerce app will retrieve the list of products based on userid. The eCommerce app often retrieves multiple recommended product lists based on multiple models and then selects a few products from each list to provide balanced recommendations to the user according to a scoring formula. How likely a product is to be recommended can be based on a weighted scoring. For example, a 20% weight is given to Model 1, a 50% weight is given to Model 2, and so on.  A product appearing in multiple models (with higher weights) will have a higher probability of being recommended to the user. 

Key-Value Problems

1) Inefficient organization of data: Each user is duplicated in each model, and each product could be duplicated many times across the database.  to find out which users have a recommendation for a given product (a reverse key-value lookup), there is no way to do this except to read the entire database and then process the results.

2) Lack of computational ability and efficiency: Key-value stores are designed to be simple — just store and quickly look up values. The simple computation of a weighted score is beyond their ability; instead an application-level program needs to be written.  This leads to transferring unnecessary data (products which won’t be recommended) from the Key-Value DB to the app (end users) and this reduces the app’s responsiveness and user experience.

3) Lack of Semantic Modeling or Partitioning – There is also one big practical issue with storing the key-value pairs (UserID-productId list in our example) for multiple recommendation models: the most popular Key-Value DBs don’t have efficient ‘namespace’ capability. This means there is no built-in capability to separate the one key-value table into different recommendation models. As a consequence, the developers either need to create and use compound keys (in our example, combining UserId with model name) if the developers use only one Key-Value DB instance (increasing memory usage) or they have to deploy multiple Key-Value DB instances, each of which is for one particular recommendation model (increasing programming complexity and cost).  

Graph Approach

In a native parallel graph database like TigerGraph, the problems described above are solved intuitively. Figure 1 shows a sample graph schema.  

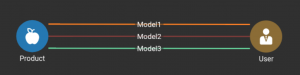
Figure 1. Sample schema for personalized recommended products

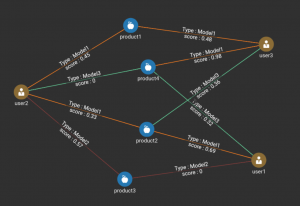
 Figure 2. Sample Data Graph 

Graph Model

Each user is represented by a single vertex, with a unique UserId key. Each product is also represented by a single unique vertex. An edge connecting a User vertex and a Product vertex means that the product is recommended to the user by the model represented by the edge’s type.  In this example, there are three types of edges to represent three models in the example. 

Simple Retrieval. It is simple and fast to get a user’s list of recommended products. The graph DB just returns the list of Products connected to the User by the edge type representing the model. Figure 3 shows the GSQL code for this retrieval.

CREATE QUERY getRecByModel(vertex<User> inputUser, string model,  int k) FOR GRAPH MyGraph { 

	Start = {inputUser};
	
	Result = SELECT t FROM Start-(model:e)-:t LIMIT k;
	
	PRINT Result;
}

Figure 3. Given a user and a model, return recommended products. 

Weighted Scoring. Unlike key-value DBs, graph DBs typically come with a query language with at least of computational ability of SQL. A weighted score is well within their ability. For example, Figure 4 uses the Turing-complete GSQL language to calculate the weighted recommendation score for each product recommended to the given user, sort the scores, and then return just the top k recommendations.  Moreover, due to the massively parallel processing (MPP) of the TigerGraph engine, even if there is a huge number of recommendations to consider, the results can be computed in real time. The GSQL query could be easily enhanced to take to take more input parameters, such as the weights of the models, to dynamically update the scoring scheme.

CREATE QUERY getRecAllModel(vertex<User> inputUser, int k) FOR GRAPH MyGraph { 
  
	MaxAccum<float> @weight;
	
	Start = {inputUser};
	
	Result = SELECT t FROM Start-(:e)-:t
	         ACCUM 
                   CASE WHEN e.type == Model1 THEN
                        [email protected] += e.score * 0.2
                   CASE WHEN e.type == Model2 THEN
                        [email protected] += e.score * 0.5
                   CASE WHEN e.type == MOdel3 THEN
                        [email protected] += e.score * 0.3
                   END
	         ORDER BY [email protected] DESC
	         LIMIT k;
	
	PRINT Result;
}

Figure 4. Given a user, return the  top k recommended products based on a weighted scoring of all the models.

Conclusion

This article shows how a graph database can efficiently solve key-value problems by saving memory, reducing query latency and simplifying app development.  Graph Database’s capability is of course far more than what is shown here. For example, we can use GraphDB to do real-time product recommendation on live data (such as collaborative filtering) instead of doing offline batch computation on stale data. The power of a native parallel graph database (compression, fast, parallel processing, ease to use SDK) really help enterprises solve a wide range of problems. 

There’s never been a better time to get started with TigerGraph and one of the best ways to do that is by scheduling a demo with one of our experts. Alternatively you can test drive or get started with our developer edition. 

You Might Also Like

Developer Spotlight: Kapil Saini

Developer Spotlight: Kapil Saini

October 21, 2022
Graph Neural Network-based Graph Outlier Detection: A Brief Introduction

Graph Neural Network-based Graph Outlier Detection:...

September 15, 2022
Developer Spotlight: Renata Bastos Gottgtroy

Developer Spotlight: Renata Bastos Gottgtroy

September 12, 2022

Introducing TigerGraph 3.0

July 1, 2020

Everything to Know to Pass your TigerGraph Certification Test

June 24, 2020

Neo4j 4.0 Fabric – A Look Behind the Curtain

February 7, 2020

TigerGraph Blog

  • Categories
    • blogs
      • About TigerGraph
      • Benchmark
      • Business
      • Community
      • Compliance
      • Customer
      • Customer 360
      • Cybersecurity
      • Developers
      • Digital Twin
      • eCommerce
      • Emerging Use Cases
      • Entity Resolution
      • Finance
      • Fraud / Anti-Money Laundering
      • GQL
      • Graph Database Market
      • Graph Databases
      • GSQL
      • Healthcare
      • Machine Learning / AI
      • Podcast
      • Supply Chain
      • TigerGraph
      • TigerGraph Cloud
    • Graph AI On Demand
      • Analysts and Research
      • Customer 360 and Entity Resolution
      • Customer Spotlight
      • Development
      • Finance, Banking, Insurance
      • Keynote
      • Session
    • Video
  • Recent Posts

    • It’s Time to Harness the Power of Graph Technology [Infographic]
    • TigerGraph Showcases Unrivaled Performance at Scale
    • TigerGraph 101 An Introduction to Graph | Jan 26th @ 9am PST
    • Data Science Salon New York
    • Tech For Retail
    TigerGraph

    Product

    SOLUTIONS

    customers

    RESOURCES

    start for free

    TIGERGRAPH DB
    • Overview
    • Features
    • GSQL Query Language
    GRAPH DATA SCIENCE
    • Graph Data Science Library
    • Machine Learning Workbench
    TIGERGRAPH CLOUD
    • Overview
    • Cloud Starter Kits
    • Login
    • FAQ
    • Pricing
    • Cloud Marketplaces
    USEr TOOLS
    • GraphStudio
    • TigerGraph Insights
    • Application Workbenches
    • Connectors and Drivers
    • Starter Kits
    • openCypher Support
    SOLUTIONS
    • Why Graph?
    industry
    • Advertising, Media & Entertainment
    • Financial Services
    • Healthcare & Life Sciences
    use cases
    • Benefits
    • Product & Service Marketing
    • Entity Resolution
    • Customer 360/MDM
    • Recommendation Engine
    • Anti-Money Laundering
    • Cybersecurity Threat Detection
    • Fraud Detection
    • Risk Assessment & Monitoring
    • Energy Management
    • Network & IT Management
    • Supply Chain Analysis
    • AI & Machine Learning
    • Geospatial Analysis
    • Time Series Analysis
    success stories
    • Customer Success Stories

    Partners

    Partner program
    • Partner Benefits
    • TigerGraph Partners
    • Sign Up
    LIBRARY
    • Resources
    • Benchmark
    • Webinars
    Events
    • Trade Shows
    • Graph + AI Summit
    • Million Dollar Challenge
    EDUCATION
    • Training & Certifications
    Blog
    • TigerGraph Blog
    DEVELOPERS
    • Developers Hub
    • Community Forum
    • Documentation
    • Ecosystem

    COMPANY

    Company
    • Overview
    • Careers
    • News
    • Press Release
    • Awards
    • Legal
    • Patents
    • Security and Compliance
    • Contact
    Get Started
    • Start Free
    • Compare Editions
    • Online Demo - Test Drive
    • Request a Demo

    Product

    • Overview
    • TigerGraph 3.0
    • TIGERGRAPH DB
    • TIGERGRAPH CLOUD
    • GRAPHSTUDIO
    • TRY NOW

    customers

    • success stories

    RESOURCES

    • LIBRARY
    • Events
    • EDUCATION
    • BLOG
    • DEVELOPERS

    SOLUTIONS

    • SOLUTIONS
    • use cases
    • industry

    Partners

    • partner program

    company

    • Overview
    • news
    • Press Release
    • Awards

    start for free

    • Request Demo
    • take a test drive
    • SUPPORT
    • COMMUNITY
    • CONTACT
    • Copyright © 2023 TigerGraph
    • Privacy Policy
    • Linkedin
    • Facebook
    • Twitter

    Copyright © 2020 TigerGraph | Privacy Policy

    Copyright © 2020 TigerGraph Privacy Policy

    • SUPPORT
    • COMMUNITY
    • COMPANY
    • CONTACT
    • Linkedin
    • Facebook
    • Twitter

    Copyright © 2020 TigerGraph

    Privacy Policy

    • Products
    • Solutions
    • Customers
    • Partners
    • Resources
    • Company
    • START FREE
    START FOR FREE
    START FOR FREE
    TigerGraph
    PRODUCT
    PRODUCT
    • Overview
    • GraphStudio UI
    • Graph Data Science Library
    TIGERGRAPH DB
    • Overview
    • Features
    • GSQL Query Language
    TIGERGRAPH CLOUD
    • Overview
    • Cloud Starter Kits
    TRY TIGERGRAPH
    • Get Started for Free
    • Compare Editions
    SOLUTIONS
    SOLUTIONS
    • Why Graph?
    use cases
    • Benefits
    • Product & Service Marketing
    • Entity Resolution
    • Customer Journey/360
    • Recommendation Engine
    • Anti-Money Laundering (AML)
    • Cybersecurity Threat Detection
    • Fraud Detection
    • Risk Assessment & Monitoring
    • Energy Management
    • Network Resources Optimization
    • Supply Chain Analysis
    • AI & Machine Learning
    • Geospatial Analysis
    • Time Series Analysis
    industry
    • Advertising, Media & Entertainment
    • Financial Services
    • Healthcare & Life Sciences
    CUSTOMERS
    read all success stories


    PARTNERS
    Partner program
    • Partner Benefits
    • TigerGraph Partners
    • Sign Up
    RESOURCES
    LIBRARY
    • Resource Library
    • Benchmark
    • Webinars
    Events
    • Trade Shows
    • Graph + AI Summit
    • Graph for All - Million Dollar Challenge
    EDUCATION
    • TigerGraph Academy
    • Certification
    Blog
    • TigerGraph Blog
    DEVELOPERS
    • Developers Hub
    • Community Forum
    • Documentation
    • Ecosystem
    COMPANY
    COMPANY
    • Overview
    • Leadership
    • Careers  
    NEWS
    PRESS RELEASE
    AWARDS
    START FREE
    Start Free
    • Request a Demo
    • SUPPORT
    • COMMUNITY
    • CONTACT
    Dr. Jay Yu

    Dr. Jay Yu | VP of Product and Innovation

    Dr. Jay Yu is the VP of Product and Innovation at TigerGraph, responsible for driving product strategy and roadmap, as well as fostering innovation in graph database engine and graph solutions. He is a proven hands-on full-stack innovator, strategic thinker, leader, and evangelist for new technology and product, with 25+ years of industry experience ranging from highly scalable distributed database engine company (Teradata), B2B e-commerce services startup, to consumer-facing financial applications company (Intuit). He received his PhD from the University of Wisconsin - Madison, where he specialized in large scale parallel database systems

    Todd Blaschka | COO

    Todd Blaschka is a veteran in the enterprise software industry. He is passionate about creating entirely new segments in data, analytics and AI, with the distinction of establishing graph analytics as a Gartner Top 10 Data & Analytics trend two years in a row. By fervently focusing on critical industry and customer challenges, the companies under Todd's leadership have delivered significant quantifiable results to the largest brands in the world through channel and solution sales approach. Prior to TigerGraph, Todd led go to market and customer experience functions at Clustrix (acquired by MariaDB), Dataguise and IBM.