


TigerGraph helps health insurers model and analyse all patient medical and claims data in order to personalise treatment, proactively encourage good health, and control costs.
The future of healthcare is for digitally connected consumers – but expectations are not being met
Customer experience (“CX”) is the new differentiator for health insurers, who are facing competitive disruption from digital-natives1,2 and the need to retain or win back high volumes of members who have lost or switched jobs during the pandemic.
Leading in CX offers an estimated $250-500m3 additional annual revenue opportunity in US Healthcare – and 70% of ex-members say they would have stayed with their previous insurer had it offered a better CX4.
Pandemic-prompted virtualisation has hastened the shift to digital in healthcare, to some extent. 2020 saw more than a 200% increase in active telehealth users5, and 80% of consumers say they’re likely to use a virtual doctor option again, even post Covid6. But why did it take a pandemic for the industry to make that progress?
Survey statistics show that healthcare insurer members are not happy with the overall experience they are being offered. More than 50% of consumers say they’d rather endure a typically frustrating experience like jury duty than deal with a health insurance issue.7 And 54% of consumers feel that their healthcare insurer doesn’t have all the contextual information needed to personalise their healthcare recommendations.8
So insurer CX is not quite right yet – which is a key risk for leading insurers, because it opens the door for digital-native entrants to the market.
Why haven’t insurers invested more into CX?
Investments in CX are much easier when margins are very healthy and there is money to use. But insurers are facing a double-edged sword on profitability. In addition to the revenue pressures of member churn, costs have also been rising significantly. In fact, costs are expected to rise 5.5% every year to 2027.9
Even before Covid, insurance costs were rising due to an aging population10, higher rates of chronic diseases10, interoperability regulation requiring software development,11,12,13 and advances in expensive new healthcare technologies that increase the cost of treatment14.
On top of that, the pandemic has increased the total cost of future claims as illnesses have worsened as a result of delayed treatments.15 It has also created additional administrative costs in processing member churn.16
How can rising costs be mitigated?
The opportunity for cost saving is in the money spent on treatment pathways that weren’t necessarily entirely required. With a right treatment, right time approach, it is estimated that cost savings of between 2-5% are achievable.17
Measures would include:
i) proactively prompting members with preventative measures to maintain their good health and prevent any illnesses developing in the first place17 and
ii) should a patient require treatment, ensuring that that patient is dealt the right treatment at the right time and in the right place – without unnecessarily escalating the level, type or location of care.17
So costs can be controlled by proactively managing every individual’s good health, and then personalising required treatments for each individual in a way that balances the recovery of their good health with minimisation of treatment cost.
But isn’t personalisation exactly what members expect from CX in the first place?
Personalisation not only helps to mitigate rising costs. That same level of personalisation underpins and delivers upon CX expectations too.
In essence, each patient must be presented with their best next step according to the need and health they have at that specific moment in time – on whichever channel they choose to engage.
That is to say: health insurers should be running a member-centric analytics engine that crunches all member and medical data and produces the best next step for the member on whichever channel they choose to engage.
It’s two birds, one stone – a single member-centric analytics platform that can both improve CX (i.e. revenue) and reduce costs.
A member-centric analytics platform could be the silver bullet – so why isn’t it being done already?
It is being done, to some extent. Insurers have all implemented some level of personalisation capability. But members still aren’t happy, because these solutions aren’t working as well as expected.
A really effective member-centric analytics platform does three things:
- It enables information to be presented to members on a real-time basis, on any channel they choose
- It triggers other automation flows that support a member’s journey – such as prompting action by the member or by an insurer employee
- It enables deep analysis of members, illnesses, treatments, providers, outcomes and claims data in order to produce insights that can underpin the insurer’s evolving cost management and experience strategies – strategies that drive future next best actions presented to customers
Building and running a really effective member-centric analytics platform that caters to both CX and strategic, actionable insight needs is really hard.
First, members want to engage with their health insurer on a whole host of different platforms – via mobile, apps, web, phone, email, fitness trackers and biosensors. And there is no easy way to anticipate which device or application they will use next – so every channel needs to be loaded with the exact same next step, at all times – and all activity data points must be collated and centralised for future analysis.
Next, all the data that is required to crunch and produce the best next step is held in many different systems, often in different formats – and usually without any easy lookup ID to connect all of the information relating to an individual or an illness together. Data sources might include medical records, provider data, claims processing tools, policy and billing applications, credit records, fitness apps, and historical claims records. Information not only needs to be matched together for analysis, but also served up in an instant to the channel of choice at the moment of choice
In addition, each patient will respond to the same treatment very differently – it depends entirely on their health and medical history. For example, there might be complications due to comorbidities, age or clinical history. So recommended next steps need to take into account very detailed and specific data for each individual, and look across a very large number of individuals to find any trends for those specific nuances.
So how does TigerGraph-powered member-centric analytics enable great CX as well as strategic insights?
TigerGraph connects all of your data within its own database and then enables you to use its native and customisable algorithms to search all or any part of that connected data at once. It presents to you the results of your search both as visualised insight and as machine-readable output that can inform triggers or next best steps.
So what sort of best next steps or insights could I get from my data using TigerGraph?
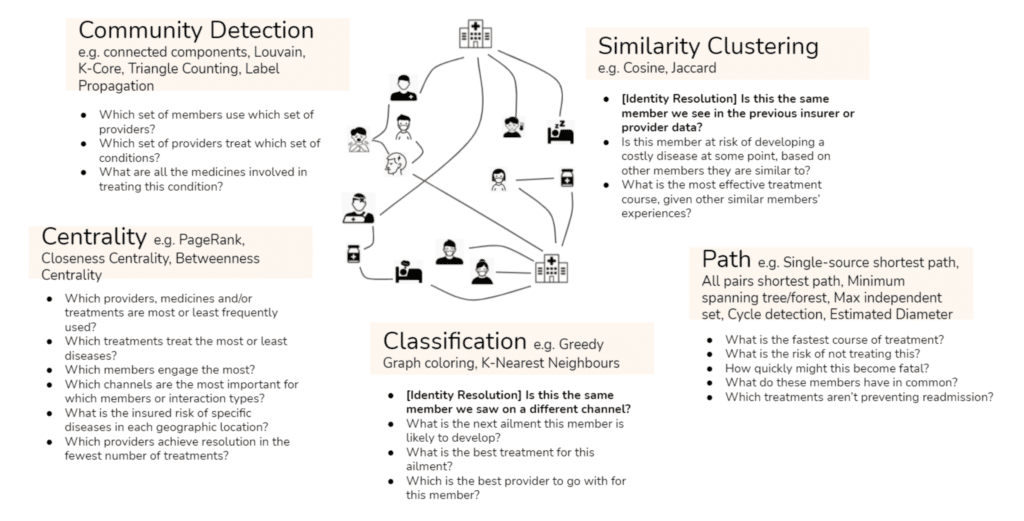
There are so many different questions you can ask of your connected data that we find it easiest to group them into categories of analytics – or in other words types of algorithms. For example, you could identify which members typically like to use which providers using community detection algorithms, or you could see which illness a member is at risk of developing using classification algorithms – or you could even predict how quickly an illness might become fatal using path algorithms.
Put simply, using TigerGraph as your member-centric analytics platform, you can run sophisticated algorithms over all of your data sources connected together. And it’s only when you can analyse all of your data sources together that:
- You can truly understand each individual’s specific situation and present or trigger the right next action on any channel.
- You can be truly informed about where costs are being incurred through unnecessary treatment options – in order to mitigate them.
- You can decide upon the most effective strategies to put in place without risking the health of any members – for example, diabetics will all go to cheaper provider X or obesity patients all get cheaper pills Y.
With the same platform driving both personalisation and right treatment-right time, you can achieve both CX improvements as well as cost savings.
Does TigerGraph replace anything in my existing architecture?
TigerGraph is additive to your architecture – and is really two technologies for the price of one: a graph database and a relationship analytics engine. Its primary contribution to your business is its unique analytical insight – derived from a combination of its ability to connect your data together and at the same time perform sophisticated analytical queries on that connected data. And you choose whether that insight is visualised or automatically actioned.
TigerGraph runs on top of your strategic cloud provider, compressing the data it stores – meaning lower storage and compute costs than alternative cloud-based approaches. It does not replace your cloud architecture.
It then outputs insight into your strategic AI/ML or data visualisation tools – and it can make that insight available to you in whichever format is most appropriate – whether through the native visualisation UI, or whether in a machine-readable output such as CSV or JSON. Again, TigerGraph is additive to your data architecture – and is intended to enhance and not replace your AI or visualisation stack.
The Database
- Compatible with and underpinned by any major cloud server (AWS, GCP, Azure), whether private or public – as well as being available on premise
- Consumes data in multiple input formats – e.g. CSV, JSON – in batch or via realtime API – to suit your data sources
- Scales horizontally, automatically – meaning the user experiences a single database even if underneath it’s spread across multiple servers
- Produces query results in real-time (TigerGraph can query more than the population of Greece every second, per server) to support real-time CX and insight
The Analytics Engine on top of the Database
- Get insight and outputs from day one with inbuilt native algorithms such as Community Detection and Classification
- De-duplicate and match data using native entity resolution algorithms even if there is no easy matching ID – enhancing the quality of your data from day one
- Infer information using native algorithms such as Cosine or Jaccard similarity
- Write any query you can possibly think of using our query language, GSQL, which is a fully customisable, Turing-complete query language that is very similar to SQL
- Use queries to print results back into your database – enabling a deep learning, iterative insight mechanism
Are there any limits I should be aware of?
Types of data. With TigerGraph, there are no limits to the number of types of data you want to include in the graph – whether it’s channel data, patient data, medical data, treatment or provider data. All of your data types and how they relate together are mastered in the schema you can create manually within the TigerGraph Graph Studio UI. You can choose to include any new data type at any time by just updating your schema and loading the data
Scale. TigerGraph is built for scale – and whilst it doesn’t provision cloud servers automatically (because we believe that is a cost and technical design that you should be able to control), it does distribute and partition data across your provisioned servers automatically. This means that the TigerGraph user experience feels like there is only one server – and the user is never asked to do anything more than once, like being asked to create queries or schema for every additional server.
Complexity of analytics. TigerGraph’s analytics engine is built for depth and breadth of query – meaning there is no limit to the number of data types or points you can include in a single query. We know that some of the most important insight comes from combining a significant number of data types and data points together at once – so we built the analytics engine to support you in whatever you need to ask of your data. We also recognise that native algorithms don’t always garner the details of the answer you need – and so we made our query language fully customisable – catering not just to any number of ifs, buts, and whens, but also enabling you to print results back into your database as new or overlaid data to be included in future queries.
Speed. It’s important to note that where other technologies purport to be able to support the flexibility, scale, and analytical power above, usually it is to the detriment of speed. This is because in effect the technology isn’t built natively to operate like that, and instead there are technical workarounds that make it possible if given the time to run. By contrast, TigerGraph was built natively for all of the above – which means it really does deliver insight in real-time speeds – and this is of paramount importance for CX if you’re wanting to deliver the next best step to a member’s channel of choice at the moment they’re looking for it.
So how do I get started with TigerGraph?
You can download our free product here if you’d like to get your hands on it straight away. Or you can reach out directly to our sales team here if you’d like to see a demo, and talk about how we could run a proof of concept with you using some of your data.
———————————————————————-
References
1 CapGemini, Nov 2020, Link
2 Bain, Sep 2020, Link
3 Accenture Insights, Nov 2020, Link
4 Accenture insights, Jun 2021, Link
5 Bain, Sep 2020, Link
6 Deloitte, Feb 2021, Link
7 BusinessWire, Feb 2020, Link
8 BusinessWire, Feb 2020, Link
9 CMS estimate, ITIJ, Feb 2021, Link
10 PolicyAdvice, Feb 2021, Link
11 Imaginea, Nov 2020, Link
12 Oracle blog, Feb 2021, Link
13 CMS Gov Interoperability Guidelines – Link
14 PolicyAdvice, Feb 2021, Link
15 McKinsey, Sep 2020, Link
16 American Progress, Apr 2021, Link
17 McKinsey, Jan 2021, Link


