Enhanced Retail Customer Experience and Profitability Made Possible by Graph Analytics
- Blog >
- Enhanced Retail Customer Experience and Profitability Made Possible by Graph Analytics
Retail businesses with multiple product lines or lines of business can struggle with data governance and understanding who their customers are. This can make it more difficult to make valuable product recommendations and enhance the customer experience.
With TigerGraph, you can turn this complexity to your advantage using graph analytics, visualizations, and tying the results into your existing technology stack.
Typically retail businesses are comprised of multiple product lines or lines of business as a result of acquisitions and mergers. Each acquisition helps the business enter into new markets, driving new potential revenue streams often from the same customer base. Cross-sales across this portfolio of product lines can be up to 75% less costly than new sales. Leveraging the whole product portfolio can increase profits in a competitive market by capitalizing on the holistic needs of every customer. This can also increase average transaction value and pull revenue forward.
From the customer’s perspective, being able to buy multiple products all in the same place, often with bundle pricing or deal discounts, is an attractive option for both price and convenience reasons. Ease of experience builds customer loyalty and drives repeat purchase behavior.
Delivering on a diversity of product lines consistently also helps retail businesses capitalize on constantly evolving consumer trends. Retail businesses with different product lines that are able to capitalize on trends can compete much more effectively – for example, homeware lines can be cross-sold to grocery customers who are working from home due to the pandemic, or vegan grocery lines can be cross-sold to homeware customers who are following health, wellbeing, and sustainability trends.
Very few retail companies with multiple lines of business are able to cross-sell across all product lines in their portfolio, because it’s so hard to do. The complexity of the operational processes required to support cross-portfolio cross-sell is high. And on top of that, consumers themselves increase the complexity of the requirement by now using an average of almost six touchpoints on different channels when buying an item, with nearly 50% regularly using more than four.
Getting Cross-selling Right
There are a number of reasons portfolio cross-selling is a really hard thing to get right. We’re going to focus on four key areas that TigerGraph helps solve.
- Master Data Management (MDM) is required to create a consistent view of customer and product entities – so that customers and products can be matched for cross-sell recommendations. There are usually multiple master sources of customer and product across a portfolio of business, meaning there is no clear single source of truth. Master Data Management requires strong data governance to determine and maintain a single source of truth for customer and product – and strong data governance is difficult to put into practice, often because it requires many manual steps from many stakeholders.
- Complex knowledge requirements – in order to bundle or relate products across business lines. Cross-sell requires broad and deep product knowledge to combine products into bundles and/or offers, which typically requires knowledge collaboration across a high number of stakeholders from different lines of business who may not even know each other.
- Analytics have to be in real-time in order to cross-sell the right thing at the right time to the right customer. This means collecting data from all the right places in real-time, analyzing it in real-time, and then sending it to the right place in real-time – any one of which may not be architecturally possible. This also means proactively planning for vulnerabilities (for example, supply chain difficulties during the pandemic) that must be addressed ahead of offering or recommending products during a customer’s real-time experience.
- Cross-sell recommendations must be delivered via omnichannel. Customer journeys are hybrid, often starting on social, progressing on an app or the web, and then finalizing in store. Channel usage is especially volatile (for example, shifting online vs. offline during the placing and easing of pandemic restrictions) meaning the delivery of cross-selling recommendations must be on multiple channels.
Making the Right Connections with TigerGraph
TigerGraph sits across the top of your master data sources, connecting, cleansing, and unifying customer and product information. Its inbuilt analytics then query all of that connected data in real-time, providing the insights or triggers required to underpin a real-time cross-sell engine that operates across all channels.
- TigerGraph connects your master data sources and helps you govern for single source of truth, enabling customers and products to be matched effectively for cross-selling recommendations
- It then enables you to perform sophisticated analytics in real-time over all of that connected data, which creates the opportunity to discover new bundles or offers based on purchase actuals, in order to increase revenue without requiring deep knowledge from multiple stakeholders across the business
- It is able to consume and process data in real-time, at scale, making it architecturally possible to both combine data sources for real-time insight and also plan ahead for vulnerable scenarios
- It makes available all analytical results and insights via a real-time API, meaning these results can be used as real-time triggers or inputs in omnichannel journeys.
How does TigerGraph work in this scenario?
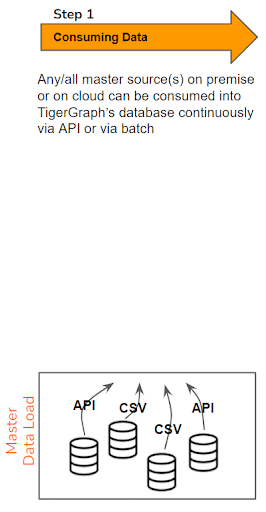
The first step is loading your data into TigerGraph’s native graph database; for example, product catalog data, CRM data, fulfillment data, integration data, or eCommerce data. Data can be loaded in batch or via API from sources either on-premises or in the cloud. TigerGraph’s database works with all three of the major cloud providers.
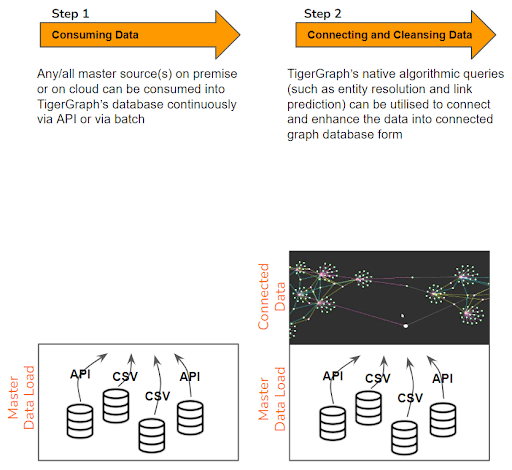
Once both the data points and the connections within your dataset are loaded into TigerGraph, there may be some inconsistencies or gaps in the data that require some cleansing:
- Duplicate data points (for example, due to naming differences in different systems) can be de-duplicated by TigerGraph’s native algorithms and merged into a master data point. This approach resolves entities like customer or product to drive towards a single source of truth.
- Missing connections between data points can be predicted by TigerGraph’s native algorithms on the basis of the rest of your data. For example, if a connection is missing between one customer and their fulfillment entry, the dates of purchase, order, and delivery might be used to make that connection. Or if one customer is not assigned to a segment but has bought the same products as other customers in a specific segment, TigerGraph’s link prediction can make the connection to the relevant segment.
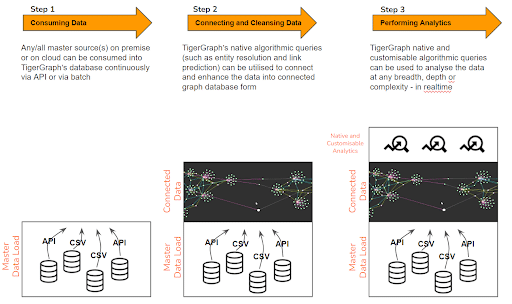
Now your connected dataset in TigerGraph is ready for you to perform analytics. You may want to use the analytics to determine new product bundles on the basis of customer purchase behavior, or perhaps you want to return the next best product recommendation for an eCommerce customer. Both hindsight and, crucially, operational “on the fly” analytics are possible, given TigerGraph’s ability to process huge amounts of data in real-time.
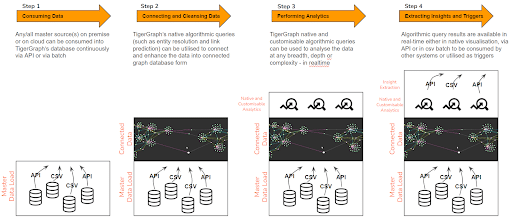
Finally, you’ll want to be able to make the results of those analytics visible and actionable. Results are visualized natively in TigerGraph’s UI as a subset of the connected data points. And in keeping with your existing IT stack, results are also available via API or as a batch download – so they can be consumed by other visualization tools or by tools that need to perform actions on the basis of the results, e.g. a recommendation pop-up in the eCommerce experience.
Breaking Down Data Silos
In a portfolio brand retail business, a number of different MDM systems might all provide insights only within their own silo. TigerGraph is able to pull all of this data together in real-time, cleanse it, and then perform the analytics required to underpin a sophisticated portfolio cross-sell engine – delivering insight to every customer engagement channel at the right time.
All insight derived by TigerGraph’s analytics engine is:
- Consistent
- Actionable
- Real-time
- Cross-portfolio
Only with the power of TigerGraph analytics can retail businesses solve the hard problems of connecting a siloed data landscape for real-time cross-sell.
Data Governance
- Strong, continuous data governance with automated entity resolution on a continuous basis for all data types, e.g. customer and product
- Entity resolution de-duplicates and merges data points with variations such as nicknames, abbreviations, or even just plain typos that have been entered into the database
- This kind of governance creates trust in the data, which makes it usable and makes insights actionable.
Product Categorization and Bundling
- Real-time product and bundle configuration using connected data analytics across all brands
- Real-time bundling optimization across all brands during flash sales like “Black Friday”
- Responsiveness to rapidly evolving external events, e.g. pandemic trends in buying new product combinations of items like masks, toilet paper, and hand sanitizer.
Customer Share of Wallet
- Having a real-time, merged, and de-duplicated view of your customer enables you to manage and increase their spent wallet across your portfolio of brands, wherever and whenever a customer touchpoint takes place
- Continuous cataloging/bundling by customer segment creates the opportunity to increase the value of individual transactions with upsell/cross-sell opportunities that are relevant within their personal journey.
Reduced Architectural Complexity
- Data that has been cleansed and resolved by TigerGraph can be fed back into all Master Data Sources so all sources always remain updated and consistent
- Downstream applications consuming from any of these master sources consume consistent data, reducing the risk of failure and complexity of workarounds, using the most accurate information in real-time.
Example: Retail Company XYZ
Let’s take a look at our fictional retail company XYZ.
Retail company XYZ has been fighting the downwards pressure on margins in a highly competitive groceries market. It is looking to outperform the competition by taking advantage of some of the upcoming national events, using them to play to predictable customer needs and preferences.
One of the upcoming national events is Shrove Tuesday/Mardi Gras. Retail company XYZ is going to have to be able to analyze its customer purchase data quickly in order to make the right product recommendations and offers to the right online customers.
First, retail company XYZ has loaded its customer and product data into TigerGraph from a number of different MDM systems that support its separate lines of business.
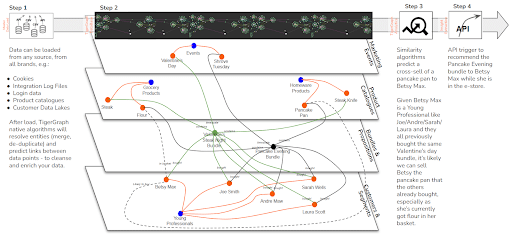
After some cleansing activity using TigerGraph’s native algorithms, the customer and product dataset from all lines of business is now fully connected. Retail company XYZ trusts that this connected dataset is showing the single source of truth for each customer and product.
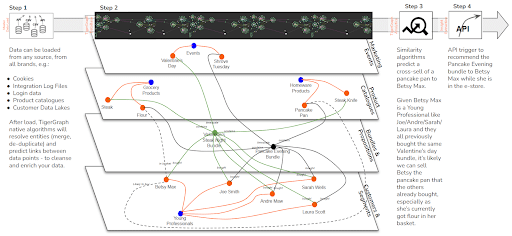
Using some simple customization of native algorithms, retail company XYZ is able to effectively ask the graph this question: which product should we cross-sell to each online customer who is on the website at the moment, given the next major national event?
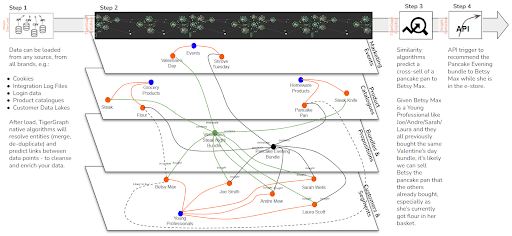
The graph determines the next best product recommendation for each customer. For one particular customer, Betsy Max, it determines that she is likely to buy a pancake pan along with some flour, for Shrove Tuesday/Mardi Gras.
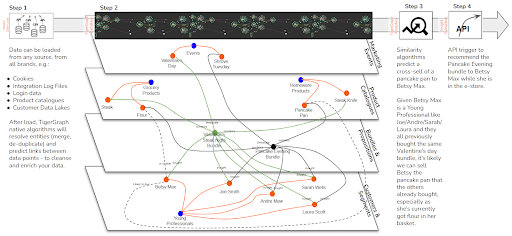
The result of this query is available via API, and so via integration triggers a pop-up within the eCommerce experience Betsy Max currently has open on her computer.
Betsy sees the pop-up and is able to choose to buy an additional item that she otherwise might not have realized she could buy from retail company XYZ. She enjoys the convenience of this experience and makes a mental note to check for other homeware items next time she shops here for groceries.
Enhance Your IT Stack, Don’t Replace It
TigerGraph is additive to your architecture and is really two technologies for the price of one: a graph database and a relationship analytics engine. Its primary contribution to your business is its unique analytical insight derived from a combination of its ability to connect your data together and at the same time perform sophisticated analytical queries on that connected data. You get to choose whether that insight is visualized or automatically actioned.
TigerGraph runs on top of your strategic cloud provider, compressing the data it stores for lower storage and compute costs than alternative cloud-based approaches. It does not replace your cloud architecture.
It then outputs insight into your strategic AI/ML or data visualization tools – and it can make that insight available to you in whichever format is most appropriate – whether through the native visualization UI or in a machine-readable output such as CSV or JSON. Again, TigerGraph is additive to your data architecture and is intended to enhance, not replace, your AI or visualization stack.
Get Started with TigerGraph
You can download our free product if you’d like to get your hands on it straight away. Or you can reach out directly to our sales team if you’d like to see a demo and talk about running a proof of concept with you using some of your data.


